Skip to content

Matplot++

A C++ Graphics Library for Data Visualization

Matplot++


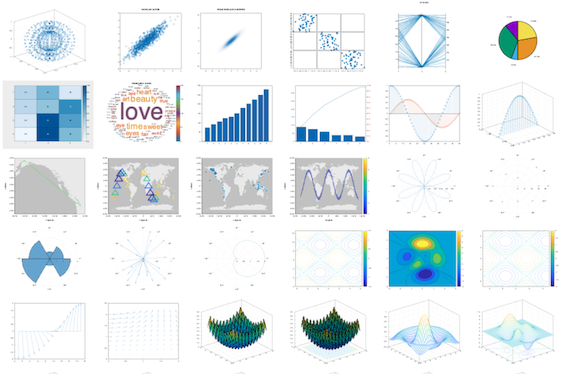
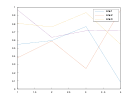
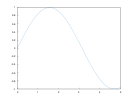
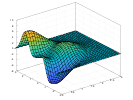
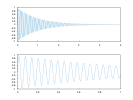
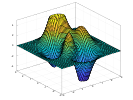
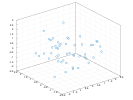
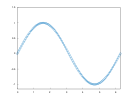
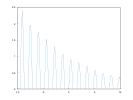
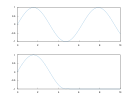
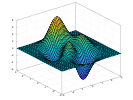
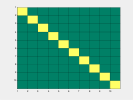
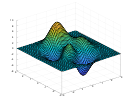
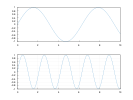
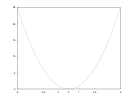
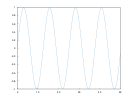
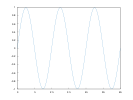
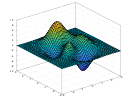
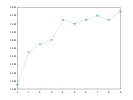
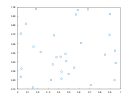
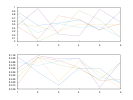
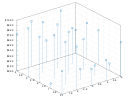
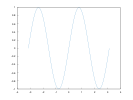
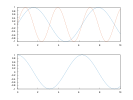
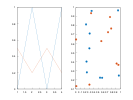
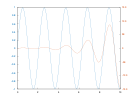
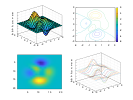
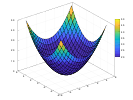
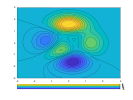
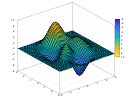
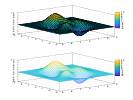
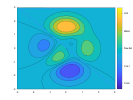
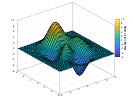
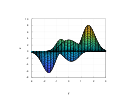
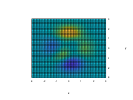
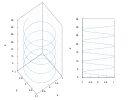
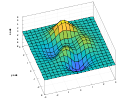
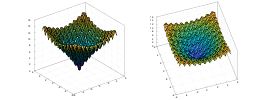
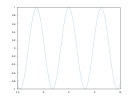
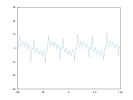
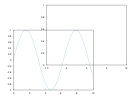
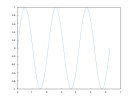
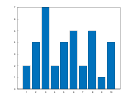
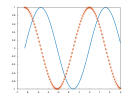
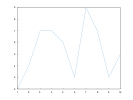
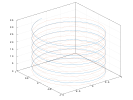
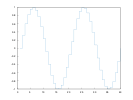
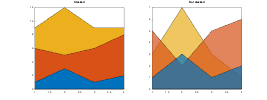
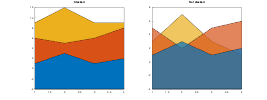
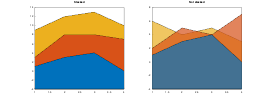
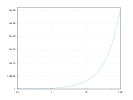
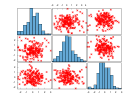
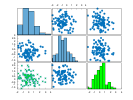
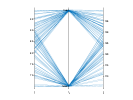
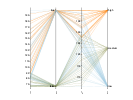
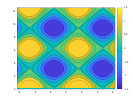
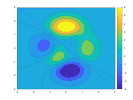
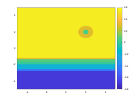
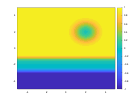
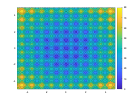
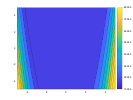
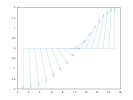
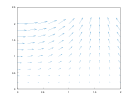
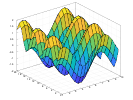
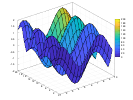
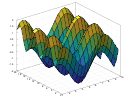
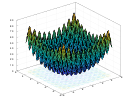
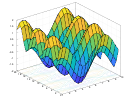
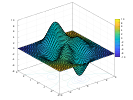
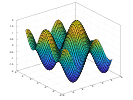
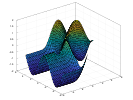
Data visualization can help programmers and scientists identify trends in their data and efficiently communicate these results with their peers. Modern C++ is being used for a variety of scientific applications, and this environment can benefit considerably from graphics libraries that attend the typical design goals toward scientific data visualization. Besides the option of exporting results to other environments, the customary alternatives in C++ are either non-dedicated libraries that depend on existing user interfaces or bindings to other languages. Matplot++ is a graphics library for data visualization that provides interactive plotting, means for exporting plots in high-quality formats for scientific publications, a compact syntax consistent with similar libraries, dozens of plot categories with specialized algorithms, multiple coding styles, and supports generic backends.


Latest Release Documentation Discussions


Facebook QZone Weibo Reddit Twitter LinkedIn WhatsApp Line.me Telegram.me HackerNews


example_plot_1 example_plot_2 example_plot_3 example_plot_4 example_plot_5 example_plot_6 example_plot_7 example_plot_8 example_plot_9 example_plot_10 example_plot_11 example_plot_12 example_plot3_1 example_plot3_2 example_plot3_3 example_plot3_4 example_plot3_5 example_plot3_6 example_plot3_7 example_plot3_8 example_plot3_9 example_plot3_10 example_stairs_1 example_stairs_2 example_stairs_3 example_stairs_4 example_stairs_5 example_stairs_6 example_stairs_7 example_stairs_8 example_stairs_9 example_stairs_10 example_errorbar_1 example_errorbar_2 example_errorbar_3 example_errorbar_4 example_errorbar_5 example_errorbar_6 example_errorbar_7 example_errorbar_8 example_errorbar_9 example_errorbar_10 example_area_1 example_area_2 example_area_3 example_area_4 example_loglog_1 example_loglog_2 example_loglog_3 example_loglog_4 example_loglog_5 example_loglog_6 example_loglog_7 example_loglog_8 example_loglog_9 example_semilogx_1 example_semilogy_1 example_fplot_1 example_fplot_2 example_fplot_3 example_fplot_4 example_fplot_5 example_fplot_6 example_fplot3_1 example_fplot3_2 example_fplot3_3 example_fplot3_4 example_fplot3_5 example_fimplicit_1 example_fimplicit_2 example_fimplicit_3 example_fimplicit_4 example_histogram_1 example_histogram_2 example_histogram_3 example_histogram_4 example_histogram_5 example_histogram_6 example_histogram_7 example_histogram_8 example_histogram_9 example_histogram_10 example_histogram_11 example_histogram_12 example_histogram_14 example_boxplot_1 example_boxplot_2 example_boxplot_3 example_scatter_1 example_scatter_2 example_scatter_3 example_scatter_4 example_scatter_5 example_scatter_6 example_scatter_7 example_scatter_8 example_scatter3_1 example_scatter3_2 example_scatter3_3 example_scatter3_4 example_scatter3_5 example_scatter3_6 example_binscatter_1 example_binscatter_2 example_binscatter_3 example_binscatter_4 example_binscatter_5 example_binscatter_6 example_binscatter_7 example_plotmatrix_1 example_plotmatrix_2 example_plotmatrix_3 example_plotmatrix_4 example_parallelplot_1 example_parallelplot_2 example_parallelplot_3 example_pie_1 example_pie_2 example_pie_3 example_pie_4 example_pie_5 example_pie_6 example_heatmap_1 example_heatmap_2 example_heatmap_3 example_heatmap_4 example_heatmap_5 example_heatmap_6 example_heatmap_7 example_wordcloud_1 example_wordcloud_3 example_wordcloud_4 example_wordcloud_4 example_bar_1 example_bar_2 example_bar_3 example_bar_4 example_bar_5 example_bar_6 example_bar_7 example_bar_8 example_bar_9 example_bar_10 example_bar_11 example_bar_12 example_bar_13 example_pareto_1 example_pareto_2 example_pareto_3 example_pareto_4 example_stem_1 example_stem_2 example_stem_3 example_stem_4 example_stem_5 example_stem_6 example_stem_7 example_stem_8 example_stem_9 example_stem3_1 example_stem3_2 example_stem3_3 example_stem3_4 example_stem3_5 example_stem3_6 example_stem3_7 example_stem3_8 example_stem3_9 example_stem3_10 example_stem3_11 example_geoplot_1 example_geoplot_2 example_geoplot_3 example_geoplot_4 example_geoplot_5 example_geoplot_6 example_geoplot_7 example_geoscatter_1 example_geoscatter_2 example_geobubble_1 example_geobubble_2 example_geodensityplot_1 example_polarplot_1 example_polarplot_2 example_polarplot_3 example_polarplot_4 example_polarplot_5 example_polarplot_6 example_polarplot_7 example_polarplot_8 example_polarscatter_1 example_polarscatter_2 example_polarscatter_3 example_polarscatter_4 example_polarscatter_5 example_polarscatter_6 example_polarhistogram_1 example_polarhistogram_2 example_polarhistogram_3 example_polarhistogram_4 example_polarhistogram_5 example_compass_1 example_compass_2 example_ezpolar_1 example_ezpolar_2 example_contour_1 example_contour_2 example_contour_3 example_contour_4 example_contour_5 example_contour_6 example_contour_7 example_contour_8 example_contourf_1 example_contourf_2 example_contourf_3 example_contourf_4 example_contourf_5 example_contourf_6 example_fcontour_1 example_fcontour_2 example_fcontour_3 example_fcontour_4 example_fcontour_5 example_fcontour_6 example_fcontour_7 example_fcontour_8 example_fcontour_9 example_fcontour_10 example_fcontour_11 example_feather_1 example_quiver_1 example_quiver_2 example_quiver_3 example_quiver_4 example_quiver_5 example_quiver_6 example_quiver3_1 example_quiver3_2 example_surf_1 example_surf_2 example_surf_3 example_surf_4 example_surf_5 example_surf_6 example_surfc_1 example_surfc_2 example_surfc_3 example_surfc_4 example_mesh_1 example_mesh_2 example_mesh_3 example_mesh_4 example_meshc_1 example_meshc_2 example_meshc_3 example_meshz_1 example_meshz_2 example_meshz_3 example_fsurf_1 example_fsurf_2 example_fsurf_3 example_fsurf_4 example_fsurf_5 example_fsurf_6 example_fsurf_7 example_fsurf_8 example_fmesh_1 example_fmesh_2 example_fmesh_3 example_fmesh_4 example_waterfall_1 example_waterfall_2 example_waterfall_3 example_fence_1 example_fence_2 example_fence_3 example_ribbon_1 example_ribbon_2 example_ribbon_3 example_ribbon_4 example_graph_1 example_graph_2 example_graph_3 example_graph_4 example_graph_5 example_graph_6 example_digraph_1 example_digraph_2 example_digraph_3 example_imshow_1 example_imshow_2 example_imshow_3 example_imshow_4 example_imshow_5 example_imshow_6 example_imshow_7 example_imshow_8 example_imshow_9 example_imshow_10 example_imshow_11 example_image_1 example_image_2 example_image_3 example_image_4 example_image_5 example_imagesc_1 example_imagesc_2 example_imagesc_3 example_imagesc_4 example_text_1 example_text_2 example_text_3 example_text_4 example_text_5 example_text_6 example_text_7 example_text_8 example_textarrow_1 example_textarrow_2 example_rectangle_1 example_rectangle_2 example_rectangle_3 example_rectangle_4 example_rectangle_5 example_fill_1 example_ellipse_1 example_textbox_1 example_arrow_1 example_arrow_2 example_line_1 example_title_1 example_title_2 example_title_3 example_title_4 example_title_5 example_title_6 example_title_7 example_title_8 example_sgtitle_1 example_sgtitle_2 example_xlabel_1 example_xlabel_2 example_xlabel_3 example_xlabel_4 example_xlabel_5 example_xlabel_6 example_xlabel_7 example_xlabel_8 example_ylabel_1 example_ylabel_2 example_ylabel_3 example_ylabel_4 example_ylabel_5 example_ylabel_6 example_ylabel_7 example_ylabel_8 example_zlabel_1 example_zlabel_2 example_zlabel_3 example_legend_1 example_legend_2 example_legend_3 example_legend_4 example_legend_5 example_legend_6 example_legend_7 example_legend_8 example_legend_9 example_xlim_1 example_xlim_2 example_xlim_3 example_xlim_4 example_xlim_5 example_xlim_6 example_ylim_1 example_ylim_2 example_ylim_3 example_ylim_4 example_ylim_5 example_ylim_6 example_zlim_1 example_zlim_2 example_zlim_3 example_zlim_4 example_zlim_5 example_zlim_6 example_axis_1 example_axis_2 example_axis_3 example_axis_4 example_axis_5 example_axis_6 example_axis_7 example_axis_8 example_box_1 example_box_2 example_box_3 example_grid_1 example_grid_2 example_grid_3 example_grid_4 example_xticks_1 example_xticks_2 example_xticks_3 example_xticks_4 example_xticks_5 example_xticks_6 example_xticks_7 example_xticks_8 example_yticks_1 example_yticks_2 example_yticks_3 example_yticks_4 example_yticks_5 example_yticks_6 example_yticks_7 example_yticks_8 example_zticks_1 example_zticks_2 example_zticks_3 example_zticks_4 example_zticks_5 example_zticks_6 example_xticklabels_1 example_xticklabels_2 example_xticklabels_3 example_xticklabels_4 example_yticklabels_1 example_yticklabels_2 example_yticklabels_3 example_yticklabels_4 example_xtickformat_1 example_xtickformat_2 example_xtickformat_3 example_xtickformat_4 example_xtickformat_5 example_ytickformat_1 example_ytickformat_2 example_ytickformat_3 example_ytickformat_4 example_ytickformat_5 example_ztickformat_1 example_ztickformat_2 example_ztickformat_3 example_ztickformat_4 example_ztickformat_5 example_xtickangle_1 example_xtickangle_2 example_xtickangle_3 example_ytickangle_1 example_ytickangle_2 example_ytickangle_3 example_hold_1 example_hold_2 example_hold_3 example_hold_4 example_yyaxis_1 example_yyaxis_2 example_yyaxis_3 example_yyaxis_4 example_yyaxis_5 example_yyaxis_6 example_yyaxis_7 example_colororder_1 example_colororder_2 example_colororder_3 example_colororder_4 example_colororder_5 example_colororder_6 example_colororder_7 example_subplot_1 example_subplot_2 example_subplot_3 example_subplot_4 example_subplot_5 example_subplot_6 example_subplot_7 example_subplot_8 example_subplot_9 example_subplot_10 example_subplot_11 example_subplot_12 example_subplot_13 example_tiledlayout_1 example_tiledlayout_2 example_tiledlayout_3 example_tiledlayout_4 example_tiledlayout_5 example_tiledlayout_6 example_tiledlayout_7 example_tiledlayout_8 example_colormap_1 example_colormap_2 example_colormap_3 example_colormap_4 example_colormap_5 example_colormap_6 example_colormap_7 example_colormap_8 example_colormap_9 example_colorbar_1 example_colorbar_2 example_colorbar_3 example_colorbar_4 example_colorbar_5 example_colorbar_6 example_colorbar_7 example_rgbplot_1 example_rgbplot_2 example_view_1 example_view_2 example_view_3 example_view_4 example_view_5 example_view_6 example_lighting_1 example_lighting_2 example_lighting_3 example_lighting_4 example_lighting_5 example_lighting_6 example_figure_1 example_figure_2 example_figure_3 example_line_spec_1 example_axes_1 example_axes_2 example_axes_3 example_axes_4 example_cla_1 example_cla_2 example_cla_3 example_save_1 example_save_2 example_save_3 example_save_4 example_save_5 example_save_6 example_save_7 example_save_8