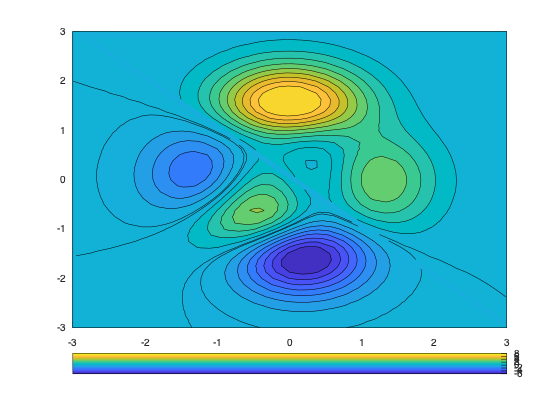
Color Bar
1 | |

1 2 3 4 5 6 7 8 9 10 11 12 | |
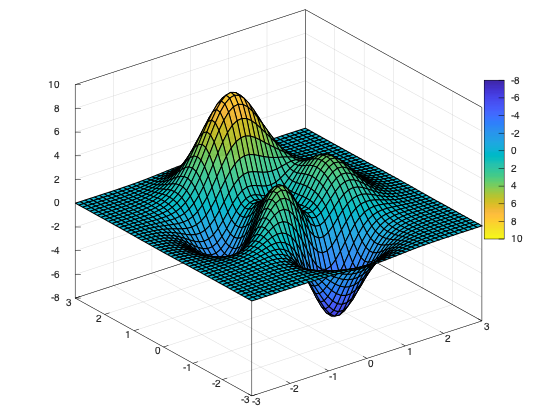
More examples
1 2 3 4 5 6 7 8 9 10 11 12 | |
1 2 3 4 5 6 7 8 9 10 11 12 | |
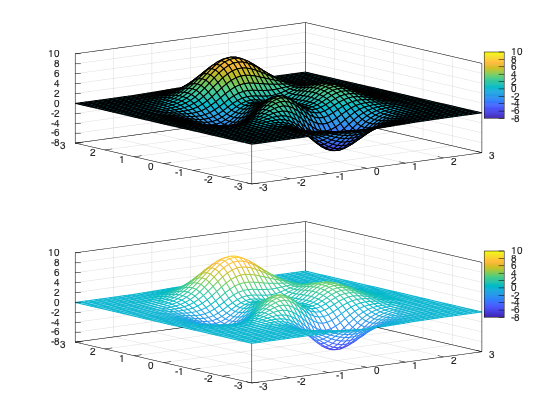
1 2 3 4 5 6 7 8 9 10 11 12 13 14 15 16 17 18 19 | |

1 2 3 4 5 6 7 8 9 10 11 12 13 14 15 16 17 18 19 | |
1 2 3 4 5 6 7 8 9 10 11 12 13 14 15 16 17 18 19 | |
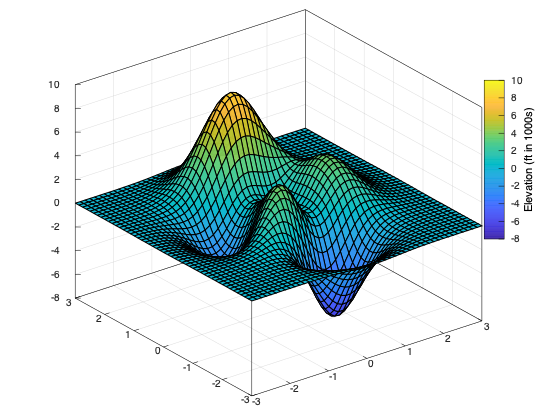
1 2 3 4 5 6 7 8 9 10 11 12 13 14 15 16 17 | |