Skip to content

Color Order

1
colororder(colors);

example_colororder_1

 1
 2
 3
 4
 5
 6
 7
 8
 9
10
11
12
13
14
15
16
17
18
19
20
21
22
23
24
25
26
27
#include <matplot/matplot.h>

int main() {
    using namespace matplot;

    vector_2d newcolors = {{0.83, 0.14, 0.14},
                           {1.00, 0.54, 0.00},
                           {0.47, 0.25, 0.80},
                           {0.25, 0.80, 0.54}};
    colororder(newcolors);

    auto x = linspace(0, 10);
    auto y1 = transform(x, [](double x) { return sin(x); });
    auto y2 = transform(x, [](double x) { return sin(x - 0.5); });
    auto y3 = transform(x, [](double x) { return sin(x - 1); });
    auto y4 = transform(x, [](double x) { return sin(x - 1.5); });

    plot(x, y1)->line_width(2);
    hold(on);
    plot(x, y2)->line_width(2);
    plot(x, y3)->line_width(2);
    plot(x, y4)->line_width(2);
    hold(off);

    show();
    return 0;
}
More examples

example_colororder_2

 1
 2
 3
 4
 5
 6
 7
 8
 9
10
11
12
13
14
15
16
17
18
19
20
21
#include <matplot/matplot.h>

int main() {
    using namespace matplot;

    std::vector<std::string> newcolors = {"#FF0000", "#FF8800", "#FFFF00",
                                          "#00BB00", "#0000FF", "#5500FF",
                                          "#AA00FF"};
    colororder(newcolors);

    hold(on);
    for (size_t r = 1; r <= 7; ++r) {
        auto x = linspace(0., static_cast<double>(r), 500);
        auto y =
            transform(x, [&](double x) { return sqrt(pow(r, 2) - pow(x, 2)); });
        plot(x, y)->line_width(15);
    }

    show();
    return 0;
}

example_colororder_3

 1
 2
 3
 4
 5
 6
 7
 8
 9
10
11
12
13
#include <matplot/matplot.h>

int main() {
    using namespace matplot;

    std::vector<std::vector<double>> newcolors = {
        {0, 0.5, 1}, {0.5, 0, 1}, {0.7, 0.7, 0.7}};
    colororder(newcolors);
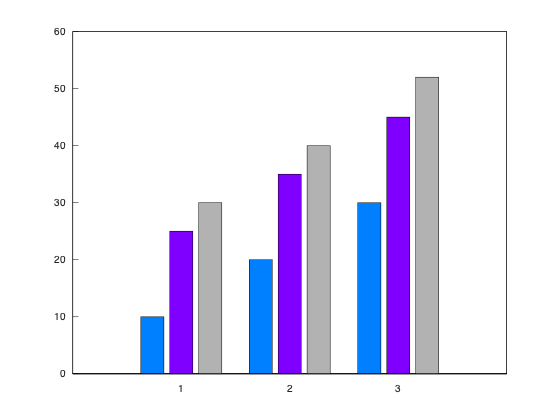
    bar(vector_2d{{10, 20, 30}, {25, 35, 45}, {30, 40, 52}});

    show();
    return 0;
}

example_colororder_4

 1
 2
 3
 4
 5
 6
 7
 8
 9
10
11
12
13
14
15
16
17
18
#include <matplot/matplot.h>

int main() {
    using namespace matplot;

    std::vector<std::vector<double>> newcolors = {{0.4, 0.3, 0.9},
                                                  {0.5, 0.65, 0.15}};
    colororder(newcolors);

    plot(vector_2d{{1, 3}, {2, 4}});
    hold(on);
    auto p2 = plot(vector_2d{{4, 2}, {3, 1}});
    p2[0]->use_y2(true);
    p2[1]->use_y2(true);

    show();
    return 0;
}

example_colororder_5

 1
 2
 3
 4
 5
 6
 7
 8
 9
10
11
12
13
14
15
16
17
18
19
20
21
#include <matplot/matplot.h>

int main() {
    using namespace matplot;

    std::vector<std::vector<double>> leftcolors = {
        {0, 0, 1}, {0, 0.5, 1}, {0, 0.8, 1}};
    colororder(leftcolors);
    plot(vector_2d{{1, 4}, {2, 5}, {3, 6}});
    auto ax = gca();
    ax->y_axis().color(ax->colororder()[0]);

    hold(on);
    auto p2 = plot(vector_2d{{4, 2}, {3, 1}}, "k-");
    p2[0]->use_y2(true);
    p2[1]->use_y2(true).line_style("--");
    ax->y_axis().color("k");

    show();
    return 0;
}

example_colororder_6

 1
 2
 3
 4
 5
 6
 7
 8
 9
10
11
12
13
14
15
16
17
#include <matplot/matplot.h>

int main() {
    using namespace matplot;

    std::vector<std::string> newcolors = {"red", "magenta", "blue"};
    colororder(newcolors);

    scatter(iota(1, 10), rand(10, 0, 1))->marker_face(true);
    hold(on);
    scatter(iota(1, 10), rand(10, 0, 1))->line_style("*k");
    scatter(iota(1, 10), rand(10, 0, 1))->marker_face(true);
    hold(off);

    show();
    return 0;
}

example_colororder_7

 1
 2
 3
 4
 5
 6
 7
 8
 9
10
11
12
13
14
15
16
17
18
19
20
21
22
23
24
25
#include <matplot/matplot.h>

int main() {
    using namespace matplot;

    tiledlayout();
    nexttile();
    auto p1 = plot(vector_2d{{1, 4}, {2, 5}, {3, 6}});
    p1[0]->line_width(2);
    p1[1]->line_width(2);
    p1[2]->line_width(2);

    auto ax = nexttile();
    auto p2 = plot(ax, vector_2d{{4, 1}, {5, 2}, {6, 3}});
    p2[0]->line_width(2);
    p2[1]->line_width(2);
    p2[2]->line_width(2);

    auto c = ax->colororder();
    c[0] = {0., 0.5, 0., 1.};
    p2[0]->color(c[0]);

    show();
    return 0;
}