Skip to content

Saving (Programatically)

You can programmatically save the figure in a number of formats with the save function:

1
save(filename);

or

1
save(filename, fileformat);

example_save_1

 1
 2
 3
 4
 5
 6
 7
 8
 9
10
11
12
13
14
15
16
17
18
#include <matplot/matplot.h>

int main() {
    using namespace matplot;

    std::vector<double> x = {29, 17, 14, 13, 12, 4, 11};
    bar(x);

    save("img/barchart.svg");
    save("img/barchart.eps");
    save("img/barchart.gif");
    save("img/barchart.jpg");
    save("img/barchart.html");
    save("img/barchart.txt");
    save("img/barchart.tex");

    return 0;
}

More examples

example_save_2

 1
 2
 3
 4
 5
 6
 7
 8
 9
10
11
12
13
14
15
16
17
18
19
20
21
22
23
24
#include <matplot/matplot.h>

int main() {
    using namespace matplot;

    auto f = figure(true);

    std::vector<double> x = {2, 4, 7, 2, 4, 5, 2, 5, 1, 4};
    bar(x);

    save("img/barchart_ps", "postscript");
    save("img/barchart_latex", "epslatex");
    /*
     * Add to your latex document:
     * \begin{figure}
     *    \input{Barchart_latex}
     * \end{figure}
     */

    save("img/barchart_gif", "gif");
    save("img/barchart_jpeg", "jpeg");

    return 0;
}

example_save_3

 1
 2
 3
 4
 5
 6
 7
 8
 9
10
11
12
13
14
15
16
17
18
19
20
21
#include <matplot/matplot.h>
#include <thread>

int main() {
    using namespace matplot;

    auto f = figure(true);
    f->font("Helvetica");

    std::vector<double> x = {2, 4, 7, 2, 4, 5, 2, 5, 1, 4};
    bar(x);

    const auto &m = backend::gnuplot::extension_terminal();
    for (const auto &[extension, format] : m) {
        (void) extension;
        save(std::string("formats/barchart ") + std::string(format),
             std::string(format));
    }

    return 0;
}

example_save_4

 1
 2
 3
 4
 5
 6
 7
 8
 9
10
11
12
#include <matplot/matplot.h>

int main() {
    using namespace matplot;

    auto [x, y, z] = peaks();
    contourf(x, y, z);

    save("img/contour.gif");

    return 0;
}

example_save_5

 1
 2
 3
 4
 5
 6
 7
 8
 9
10
11
12
13
#include <matplot/matplot.h>

int main() {
    using namespace matplot;

    auto f = figure(true);

    plot(rand(5, 5, 0, 1));
    save("img/lineplot.eps");
    save("img/lineplot.jpg");

    return 0;
}

example_save_6

 1
 2
 3
 4
 5
 6
 7
 8
 9
10
11
#include <matplot/matplot.h>

int main() {
    using namespace matplot;

    plot(iota(1, 10));
    textarrow(2, 8, 5, 5, "y=x");
    save("img/annotation.eps");

    return 0;
}

example_save_7

 1
 2
 3
 4
 5
 6
 7
 8
 9
10
11
12
13
14
#include <matplot/matplot.h>

int main() {
    using namespace matplot;

    tiledlayout(2, 1);
    nexttile();
    plot({1., 2., 3.});
    nexttile();
    plot({3., 2., 1.});
    save("img/layout.eps");

    return 0;
}

example_save_8

 1
 2
 3
 4
 5
 6
 7
 8
 9
10
11
12
#include <matplot/matplot.h>

int main() {
    using namespace matplot;

    auto [x, y, z] = peaks();
    surf(x, y, z);
    save("img/peaks.gif");
    save("img/peaks.eps");
    show();
    return 0;
}

The first option (save(filename)) infers the appropriate file format from the filename extension. In both cases (save(filename) and save(filename,fileformat)), this function temporarily changes the backend to a non-interactive backend appropriate to draw the figure. A different backend is used for each format and, depending on the format, the final image does not necessarily match what is on the interactive plot window. The reason is that some file formats purposefully do not include the same features.

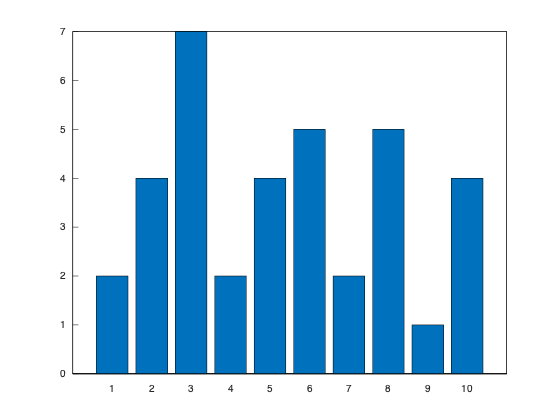
For instance, consider the bar chart generated by

1
2
vector<double> x = {29, 17, 14, 13, 12, 4, 11};
bar(x);

If we export the image with

1
save("barchart.svg");

we get the vector graphics

See result

Barchart as SVG file

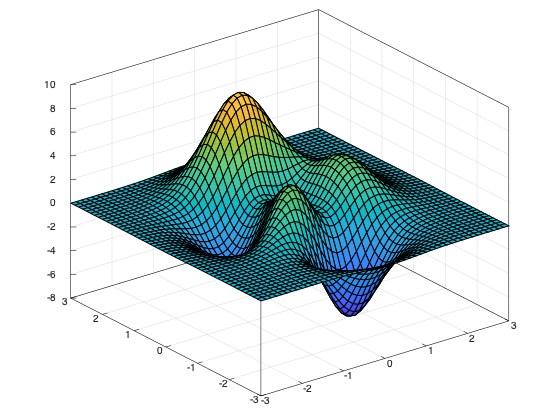
Exporting the image with

1
save("barchart.txt");

generates a representation of the image appropriate for text or markdown files, such as

See result

 1
 2
 3
 4
 5
 6
 7
 8
 9
10
11
12
13
14
15
16
17
18
19
20
21
       30 +-----------------------------------------------------------+
          |    *******   +       +      +       +      +       +      |
          |    *     *                                                |
       25 |-+  *     *                                              +-|
          |    *     *                                                |
          |    *     *                                                |
       20 |-+  *     *                                              +-|
          |    *     *                                                |
          |    *     ********                                         |
       15 |-+  *     **     *                                       +-|
          |    *     **     * *******                                 |
          |    *     **     * *     ******** *******                  |
          |    *     **     * *     **     * *     *        *******   |
       10 |-+  *     **     * *     **     * *     *        *     * +-|
          |    *     **     * *     **     * *     *        *     *   |
          |    *     **     * *     **     * *     *        *     *   |
        5 |-+  *     **     * *     **     * *     ******** *     * +-|
          |    *     **     * *     **     * *     **     * *     *   |
          |    *  +  **  +  * *  +  **  +  * *  +  **  +  * *  +  *   |
        0 +-----------------------------------------------------------+
                  1      2       3      4       5      6       7

As the last example, saving an image with

1
save("barchart.tex");

would save the image in a format appropriate to embed in latex documents, such as

See result

Barchart - Latex

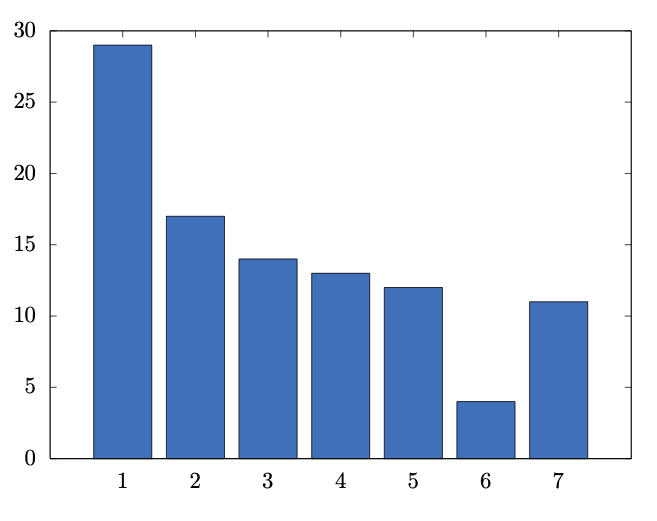
This exports the image in a format in which the labels are replaced by latex text so that the plot fits the rest of the document.