#include <cmath>
#include <matplot/matplot.h>
int main() {
using namespace matplot;
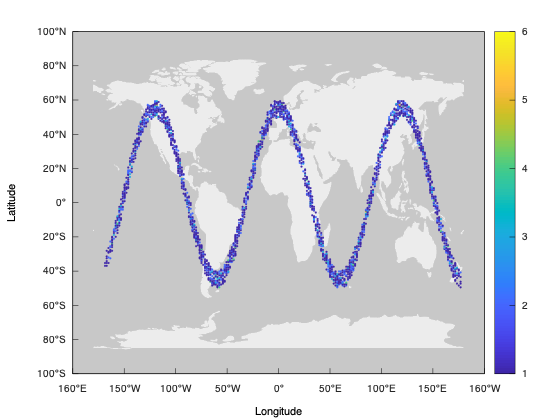
std::vector<double> lon =
transform(linspace(-170, 170, 3000),
[](double x) { return x + 10. * rand(0, 1); });
std::vector<double> lat = transform(
lon, [](double x) { return 50. * cosd(3 * x) + 10 * rand(0, 1); });
std::vector<double> weights =
transform(lon, [](double lon) { return 101. + 100 * (sind(2 * lon)); });
geodensityplot(lat, lon);
show();
return 0;
}