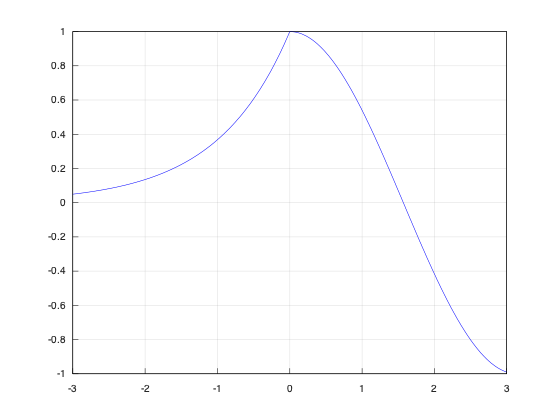
Function Plot
1 | |

1 2 3 4 5 6 7 8 9 10 11 12 13 14 15 | |
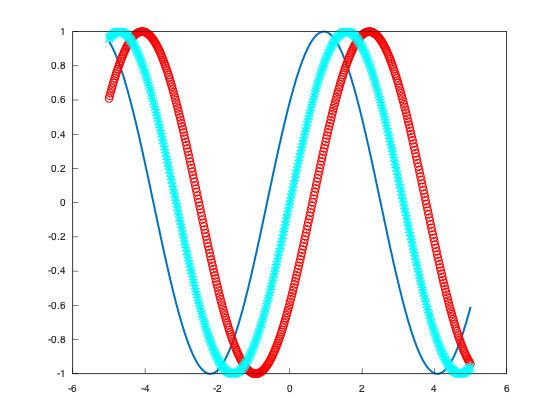
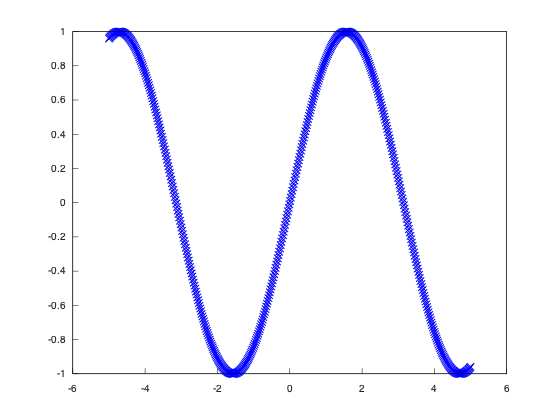
More examples

1 2 3 4 5 6 7 8 9 10 11 12 | |
1 2 3 4 5 6 7 8 9 10 11 12 13 14 15 | |
1 2 3 4 5 6 7 8 9 10 11 12 13 14 15 16 | |
1 2 3 4 5 6 7 8 9 10 11 12 13 14 15 | |

1 2 3 4 5 6 7 8 9 10 11 12 13 14 15 16 17 18 19 20 21 | |
Instead of storing data points, the objects function line and string function store a function as a lambda function or as a string with an expression. These objects use lazy evaluation to generate absolute data points. The data is generated only when the draw function is called.