Skip to content

Function Contour

1
fcontour(f);

example_fcontour_1

 1
 2
 3
 4
 5
 6
 7
 8
 9
10
11
#include <matplot/matplot.h>

int main() {
    using namespace matplot;

    auto f = [](double x, double y) { return sin(x) + cos(y); };
    fcontour(f);

    show();
    return 0;
}

More examples

example_fcontour_2

 1
 2
 3
 4
 5
 6
 7
 8
 9
10
11
12
13
14
15
16
17
18
#include <matplot/matplot.h>
#include <thread>

int main() {
    using namespace matplot;

    fcontour([](double x, double y) { return erf(x) + cos(y); },
             {-5, 0, -5, +5}, iota(-2, 0.5, 2));
    hold(on);
    fcontour([](double x, double y) { return sin(x) + cos(y); }, {0, 5, -5, +5},
             iota(-2, 0.5, 2));
    hold(off);
    axis({-5, +5, -5, +5});
    grid(on);

    show();
    return 0;
}

example_fcontour_3

 1
 2
 3
 4
 5
 6
 7
 8
 9
10
11
12
#include <matplot/matplot.h>
#include <thread>

int main() {
    using namespace matplot;

    auto f = [](double x, double y) { return pow(x, 2) - pow(y, 2); };
    fcontour(f, "--")->line_width(2);

    show();
    return 0;
}

example_fcontour_4

 1
 2
 3
 4
 5
 6
 7
 8
 9
10
11
12
13
14
#include <matplot/matplot.h>
#include <thread>

int main() {
    using namespace matplot;

    fcontour([](double x, double y) { return sin(x) + cos(y); });
    hold(on);
    fcontour([](double x, double y) { return x - y; });
    hold(off);

    show();
    return 0;
}

example_fcontour_5

 1
 2
 3
 4
 5
 6
 7
 8
 9
10
11
12
13
14
15
#include <matplot/matplot.h>
#include <thread>

int main() {
    using namespace matplot;

    auto f = [](double x, double y) {
        return exp(-pow(x / 3, 2) - pow(y / 3, 2)) +
               exp(-pow(x + 2, 2) - pow(y + 2, 2));
    };
    fcontour(f)->line_width(1).line_style("--").levels({1, 0.9, 0.8, 0.2, 0.1});

    show();
    return 0;
}

example_fcontour_6

 1
 2
 3
 4
 5
 6
 7
 8
 9
10
11
12
13
14
15
#include <matplot/matplot.h>
#include <thread>

int main() {
    using namespace matplot;

    auto f = [](double x, double y) {
        return erf(pow(y + 2, 3)) -
               exp(-0.65 * (pow(x - 2, 2) + pow(y - 2, 2)));
    };
    fcontour(f)->filled(true).colormap_line_when_filled(true);

    show();
    return 0;
}

example_fcontour_7

 1
 2
 3
 4
 5
 6
 7
 8
 9
10
11
12
13
14
15
#include <matplot/matplot.h>
#include <thread>

int main() {
    using namespace matplot;

    auto f = [](double x, double y) {
        return erf(pow(y + 2, 3)) -
               exp(-0.65 * (pow(x - 2, 2) + pow(y - 2, 2)));
    };
    fcontour(f, 25)->filled(true).colormap_line_when_filled(true);

    show();
    return 0;
}

example_fcontour_8

 1
 2
 3
 4
 5
 6
 7
 8
 9
10
11
12
13
#include <matplot/matplot.h>
#include <thread>

int main() {
    using namespace matplot;

    fcontour([](double x, double y) {
        return sin(x) + cos(y);
    })->levels({-1, 0, +1});

    show();
    return 0;
}

example_fcontour_9

 1
 2
 3
 4
 5
 6
 7
 8
 9
10
11
12
13
14
15
#include <matplot/matplot.h>
#include <thread>

int main() {
    using namespace matplot;

    auto rastrigin = [](double x, double y) {
        return 10 * 2 + pow(x, 2) - 10 * cos(2 * pi * x) + pow(y, 2) -
               10 * cos(2 * pi * y);
    };
    fcontour(rastrigin)->filled(true);

    show();
    return 0;
}

example_fcontour_10

 1
 2
 3
 4
 5
 6
 7
 8
 9
10
11
12
13
14
#include <matplot/matplot.h>

int main() {
    using namespace matplot;

    auto ackley = [](double x, double y) {
        return -20 * exp(-0.2 * sqrt(0.5 * (pow(x, 2) + pow(y, 2)))) -
               exp(0.5 * (cos(2 * pi * x) + cos(2 * pi * y))) + exp(1) + 20;
    };
    fcontour(ackley)->n_levels(50).filled(true);

    show();
    return 0;
}

example_fcontour_11

 1
 2
 3
 4
 5
 6
 7
 8
 9
10
11
12
13
14
#include <matplot/matplot.h>
#include <thread>

int main() {
    using namespace matplot;

    auto rosenbrock = [](double x, double y) {
        return 100 * pow(y - pow(x, 2.), 2.) + pow(1. - x, 2.);
    };
    fcontour(rosenbrock)->n_levels(10).filled(true);

    show();
    return 0;
}

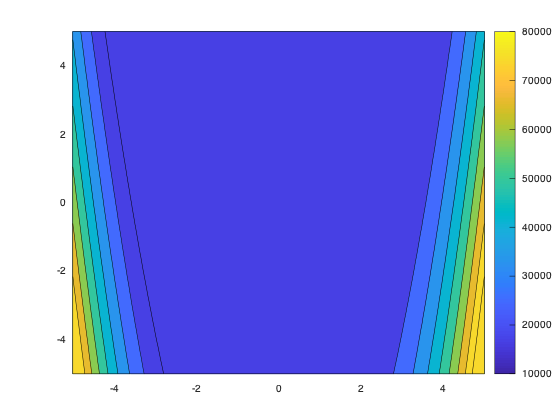
By default, the function fcontour will generate 9 contour lines from a lambda function. The functions contour and contourf, on the other hand, plot contour lines and filled contour lines from a grid of data points for , , and .