Skip to content

Plot Matrix

1
plotmatrix(X);

example_plotmatrix_1

 1
 2
 3
 4
 5
 6
 7
 8
 9
10
11
12
13
14
15
16
#include <matplot/matplot.h>
#include <random>
#include <tuple>

int main() {
    using namespace matplot;

    std::vector<std::vector<double>> X = {randn(50, 0, 1), randn(50, 0, 1),
                                          randn(50, 0, 1)};
    std::vector<std::vector<double>> Y = {iota(1, 50), iota(51, 100),
                                          iota(101, 150)};
    plotmatrix(X, Y);

    show();
    return 0;
}

More examples

example_plotmatrix_2

 1
 2
 3
 4
 5
 6
 7
 8
 9
10
11
12
13
14
#include <matplot/matplot.h>
#include <random>
#include <tuple>

int main() {
    using namespace matplot;

    std::vector<std::vector<double>> X = {randn(200, 0, 1), randn(200, 0, 1),
                                          randn(200, 0, 1)};
    plotmatrix(X);

    show();
    return 0;
}

example_plotmatrix_3

 1
 2
 3
 4
 5
 6
 7
 8
 9
10
11
12
13
14
#include <matplot/matplot.h>
#include <random>
#include <tuple>

int main() {
    using namespace matplot;

    std::vector<std::vector<double>> X = {randn(200, 0, 1), randn(200, 0, 1),
                                          randn(200, 0, 1)};
    plotmatrix(X, "*r");

    show();
    return 0;
}

example_plotmatrix_4

 1
 2
 3
 4
 5
 6
 7
 8
 9
10
11
12
13
14
15
16
17
18
19
#include <matplot/matplot.h>
#include <random>
#include <tuple>

int main() {
    using namespace matplot;

    std::vector<std::vector<double>> X = {randn(100, 0, 1), randn(100, 0, 1),
                                          randn(100, 0, 1)};

    auto [S, H, axs] = plotmatrix(X);
    (void) H;
    S[2][0]->color("g");
    S[2][0]->marker("*");
    axs[0][1]->title("A Comparison of Data Sets");

    show();
    return 0;
}

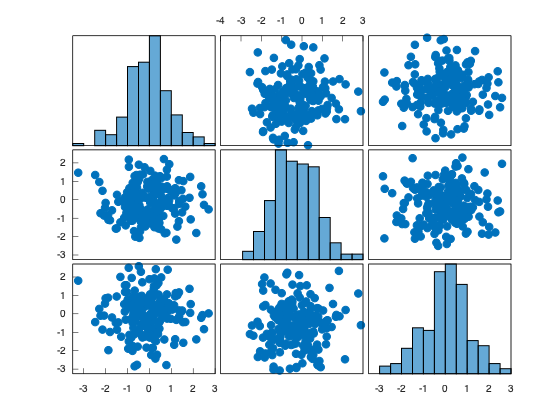
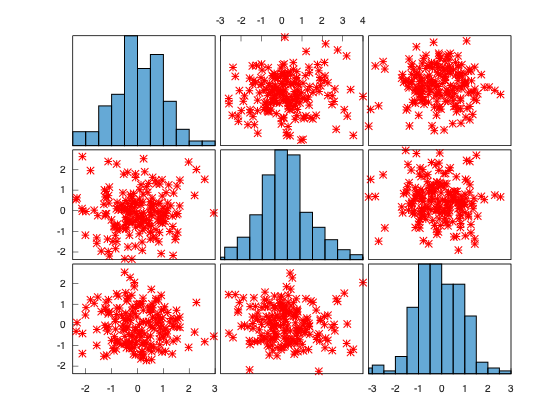
The Plot Matrix subcategory is a combination of histograms and scatter plots. It creates a matrix of axes objects on the figure and creates a scatter plot for each pair of data sets.