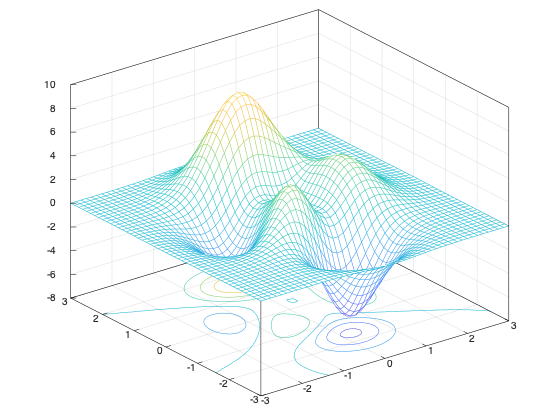
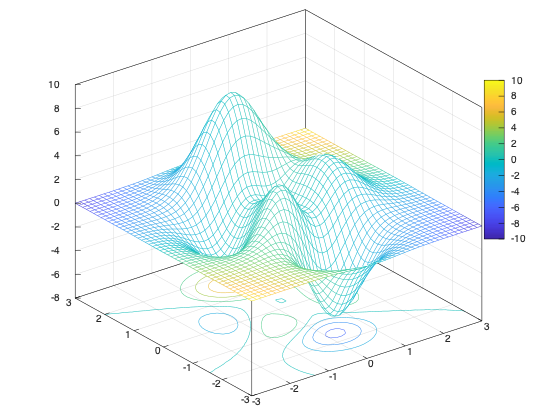
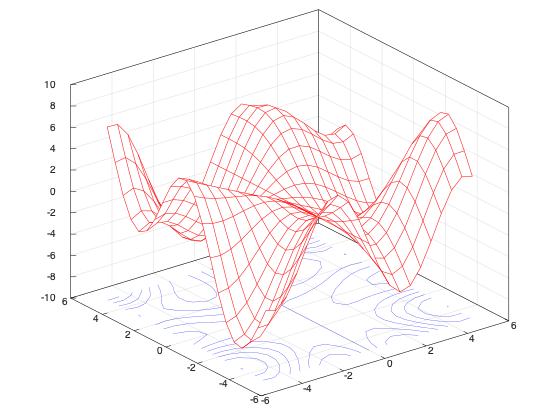
Mesh with Contour 1meshc(X, Y, Z); Plot C++ 1 2 3 4 5 6 7 8 9 10 11 12#include <cmath> #include <matplot/matplot.h> int main() { using namespace matplot; auto [X, Y] = meshgrid(iota(-3, .125, +3)); auto Z = peaks(X, Y); meshc(X, Y, Z); show(); return 0; } More examples Plot C++ 1 2 3 4 5 6 7 8 9 10 11 12 13 14#include <cmath> #include <matplot/matplot.h> int main() { using namespace matplot; auto [X, Y] = meshgrid(iota(-3, .125, +3)); auto Z = peaks(X, Y); auto C = transform(X, Y, [](double x, double y) { return x * y; }); meshc(X, Y, Z, C); colorbar(); show(); return 0; } Plot C++ 1 2 3 4 5 6 7 8 9 10 11 12 13 14 15#include <cmath> #include <matplot/matplot.h> int main() { using namespace matplot; auto [X, Y] = meshgrid(iota(-5, .5, +5)); auto Z = transform( X, Y, [](double x, double y) { return y * sin(x) - x * cos(y); }); auto sc = meshc(X, Y, Z); sc->edge_color("r"); sc->contour_line_spec().color("b"); show(); return 0; }