Skip to content

Function Plot 3D

1
fplot(fxy);

example_fplot3_1

```cpp

include

include

int main() { using namespace matplot;

1
2
3
4
5
6
7
auto xt = [](double t) { return sin(t); };
auto yt = [](double t) { return cos(t); };
auto zt = [](double t) { return t; };
fplot3(xt, yt, zt);

show();
return 0;

} `````

More examples

example_fplot3_2

 1
 2
 3
 4
 5
 6
 7
 8
 9
10
11
12
13
14
#include <cmath>
#include <matplot/matplot.h>

int main() {
    using namespace matplot;

    auto xt = [](double t) { return exp(-t / 10.) * sin(5 * t); };
    auto yt = [](double t) { return exp(-t / 10.) * cos(5 * t); };
    auto zt = [](double t) { return t; };
    fplot3(xt, yt, zt, std::array<double, 2>{-10, 10});

    show();
    return 0;
}

example_fplot3_3

 1
 2
 3
 4
 5
 6
 7
 8
 9
10
11
12
13
14
15
16
17
18
19
#include <cmath>
#include <matplot/matplot.h>

int main() {
    using namespace matplot;

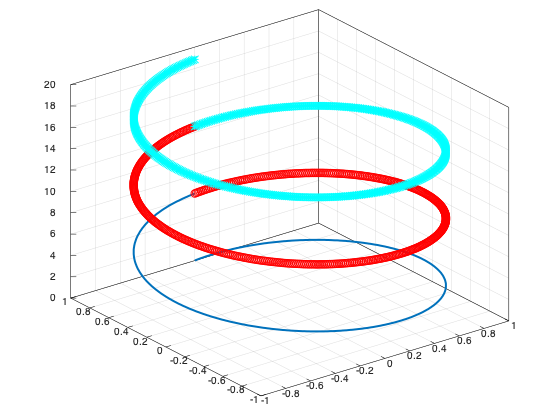
    auto sin_t = [](double t) { return sin(t); };
    auto cos_t = [](double t) { return cos(t); };
    auto t_t = [](double t) { return t; };
    auto fp = fplot3(sin_t, cos_t, t_t, std::array<double, 2>{0, 2 * pi})
                  ->line_width(2);
    hold(on);
    fplot3(sin_t, cos_t, t_t, std::array<double, 2>{2 * pi, 4 * pi}, "--or");
    fplot3(sin_t, cos_t, t_t, std::array<double, 2>{4 * pi, 6 * pi}, "-.*c");
    hold(off);

    show();
    return 0;
}

example_fplot3_4

 1
 2
 3
 4
 5
 6
 7
 8
 9
10
11
12
13
14
15
16
17
18
19
20
21
22
23
24
25
26
27
28
29
30
31
32
33
#include <cmath>
#include <matplot/matplot.h>
#include <thread>

int main() {
    using namespace matplot;

    auto xt = [](double t) {
        return exp(-std::abs(t) / 10) * sin(5 * std::abs(t));
    };
    auto yt = [](double t) {
        return exp(-std::abs(t) / 10) * cos(5 * std::abs(t));
    };
    auto zt = [](double t) { return t; };
    auto fp = fplot3(xt, yt, zt)->t_range({-10, 10}).color("r");
    xlabel("e^{-|z|/10} sin(2|z|)");
    ylabel("e^{-|z|/10} cos(2|z|)");
    zlabel("z");
    grid(true);

    auto ax = gca();
    float da = ax->azimuth();
    float de = ax->elevation();
    for (size_t i = 0; i <= 180; ++i) {
        view(da + 2 * i, de + i);
        title("Azimuth: " + num2str(da + 2 * i) +
              " Elevation: " + num2str(de + i));
        std::this_thread::sleep_for(std::chrono::milliseconds(50));
    }

    show();
    return 0;
}

example_fplot3_5

 1
 2
 3
 4
 5
 6
 7
 8
 9
10
11
12
13
14
15
16
17
18
19
20
21
22
23
24
25
26
27
28
29
30
31
#include <cmath>
#include <matplot/matplot.h>

int main() {
    using namespace matplot;

    auto xt = [](double t) { return t; };
    auto yt = [](double t) { return t / 2.; };
    auto zt = [](double t) { return sin(6. * t); };
    fplot3(xt, yt, zt, std::array<double, 2>{-2 * pi, 2 * pi})
        ->mesh_density(300)
        .line_width(1);

    title("x=t, y=t/2, z=sin(6t) for -2π<t<2π");
    xlabel("x");
    ylabel("y");
    view(52.5, 30);
    box(on);
    xrange({-2 * pi, +2 * pi});
    yrange({-pi, +pi});

    auto ax = gca();
    ax->xticks(iota(-2 * pi, pi / 2, 2 * pi));
    ax->x_axis().ticklabels(
        {"-2π", "-3π/2", "-π", "-π/2", "0", "π/2", "π", "3π/2", "π"});
    ax->yticks(iota(-pi, pi / 2, pi));
    ax->y_axis().ticklabels({"-π", "-π/2", "0", "π/2", "π"});

    show();
    return 0;
}