Tiled Layout
tiledlayout ( rows , cols );
nexttile ();
More examples
Plot
C++
1
2
3
4
5
6
7
8
9
10
11
12
13
14
15
16
17
18
19
20
21
22
23
24
25
26
27
28
29
30
31
32
33
34 #include <iostream>
#include <matplot/matplot.h>
#include <set>
#include <thread>
#include <vector>
int main () {
using namespace matplot ;
auto x = linspace ( 0 , 30 );
auto y1 = transform ( x , []( double x ) { return sin ( x / 2 ); });
auto y2 = transform ( x , []( double x ) { return sin ( x / 3 ); });
auto y3 = transform ( x , []( double x ) { return sin ( x / 4 ); });
tiledlayout ();
nexttile ();
plot ( x , y1 );
nexttile ();
plot ( x , y2 );
nexttile ();
plot ( x , y3 );
nexttile ();
plot ( x , y1 );
hold ( on );
plot ( x , y2 );
plot ( x , y3 );
hold ( off );
show ();
return 0 ;
}
Plot
C++
1
2
3
4
5
6
7
8
9
10
11
12
13
14
15
16
17
18
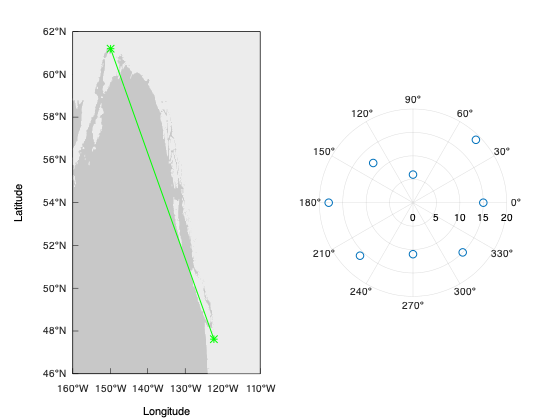
19 #include <matplot/matplot.h>
int main () {
using namespace matplot ;
tiledlayout ( 1 , 2 );
nexttile ();
geoplot ( vector_1d { 47.62 , 61.20 }, vector_1d { -122.33 , -149.90 }, "g-*" );
geolimits ({ 46 , 62 }, { -160 , -110 });
nexttile ();
auto theta = iota ( pi / 4 , pi / 4 , 2 * pi );
std :: vector < double > rho = { 19 , 6 , 12 , 18 , 16 , 11 , 15 , 15 };
polarscatter ( theta , rho );
show ();
return 0 ;
}
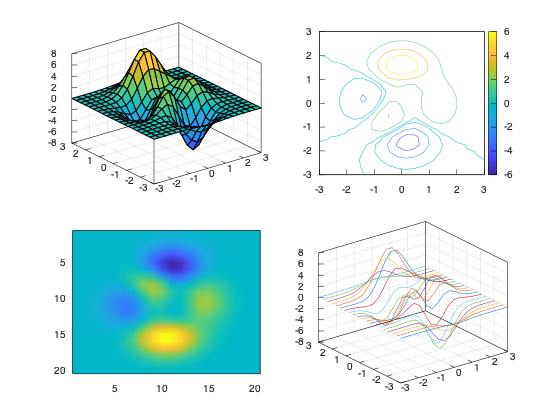
Plot
C++
 1
 2
 3
 4
 5
 6
 7
 8
 9
10
11
12
13
14
15
16
17
18
19
20
21
22
23
24
25
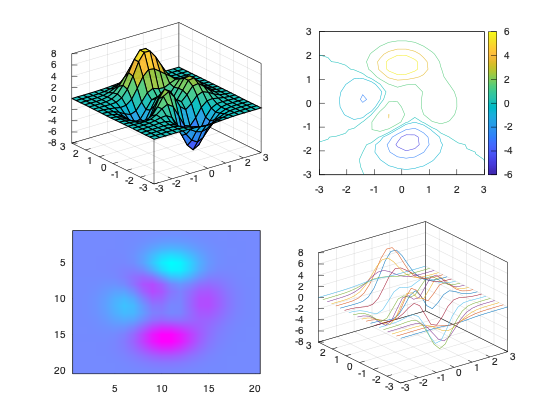
26 #include <matplot/matplot.h>
int main () {
using namespace matplot ;
tiledlayout ( 2 , 2 );
auto [ x , y , z ] = peaks ( 20 );
nexttile ();
surf ( x , y , z );
nexttile ();
contour ( x , y , z );
nexttile ();
imagesc ( z );
nexttile ();
plot3 ( x , y , z );
auto ax = nexttile ( 2 );
colormap ( ax , palette :: cool ());
show ();
return 0 ;
}
Our tiling functions are convenience shortcuts for the subplot functions. If there is no room for the next tile, we automatically rearrange the axes and increase the number of subplot rows or columns to fit the next tile. Use subplots for more control over the subplots.