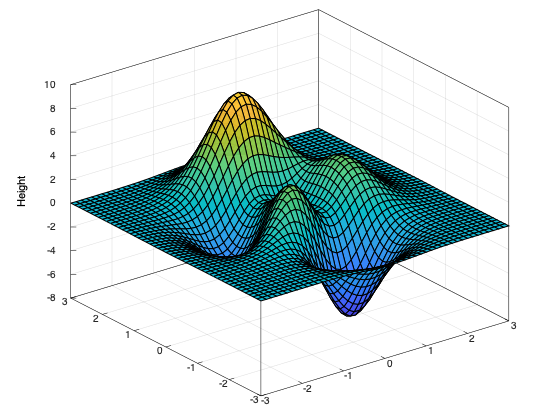
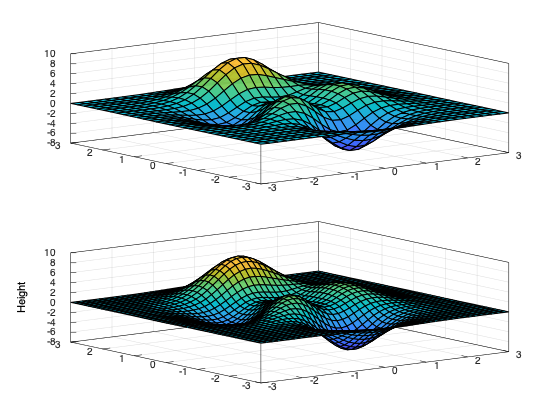
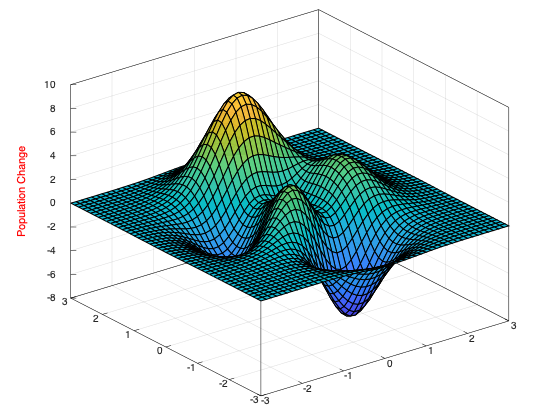
Z Label 1zlabel(str); Plot C++ 1 2 3 4 5 6 7 8 9 10 11#include <matplot/matplot.h> int main() { using namespace matplot; auto [X, Y, Z] = peaks(); surf(X, Y, Z); zlabel("Height"); show(); return 0; } More examples Plot C++ 1 2 3 4 5 6 7 8 9 10 11 12 13 14 15 16 17 18#include <matplot/matplot.h> int main() { using namespace matplot; tiledlayout(2, 1); auto ax1 = nexttile(); auto [X, Y, Z] = peaks(30); surf(ax1, X, Y, Z); auto ax2 = nexttile(); auto [X2, Y2, Z2] = peaks(45); surf(ax2, X2, Y2, Z2); zlabel(ax2, "Height"); show(); return 0; } Plot C++ 1 2 3 4 5 6 7 8 9 10 11 12 13#include <matplot/matplot.h> int main() { using namespace matplot; auto [X, Y, Z] = peaks(); surf(X, Y, Z); zlabel("Population Change"); gca()->z_axis().label_color("red"); show(); return 0; }