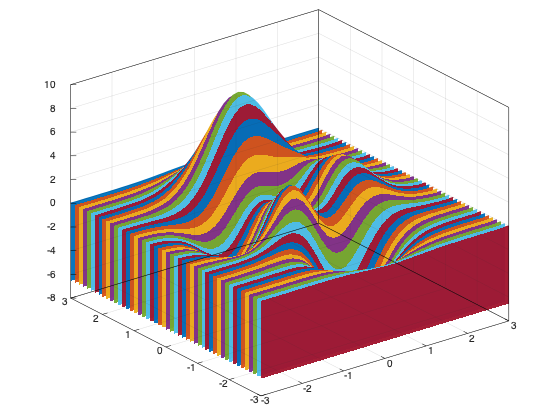
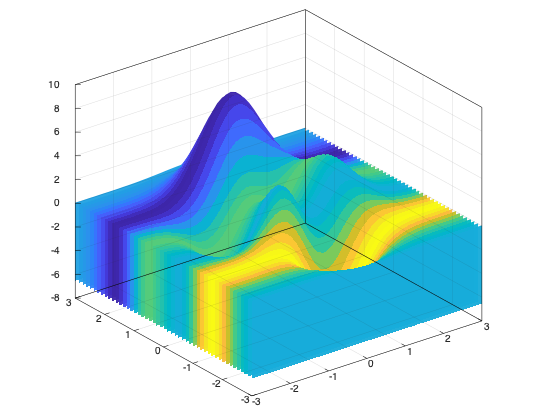
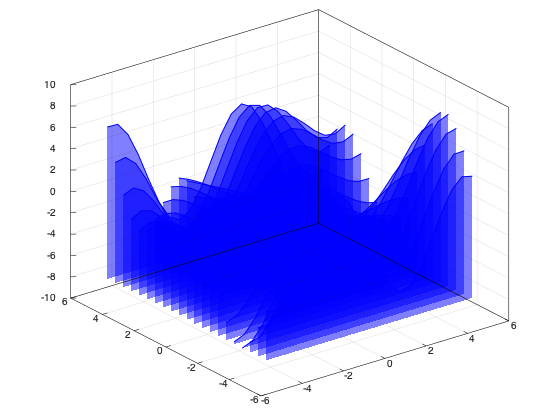
Skip to content

Fence

1
fence(X, Y, Z);

example_fence_1

 1
 2
 3
 4
 5
 6
 7
 8
 9
10
11
12
#include <cmath>
#include <matplot/matplot.h>

int main() {
    using namespace matplot;
    auto [X, Y] = meshgrid(iota(-3, .125, 3));
    auto Z = peaks(X, Y);
    fence(X, Y, Z);

    show();
    return 0;
}

More examples

example_fence_2

 1
 2
 3
 4
 5
 6
 7
 8
 9
10
11
12
13
14
15
16
17
18
#include <cmath>
#include <matplot/matplot.h>

int main() {
    using namespace matplot;
    auto [X, Y] = meshgrid(iota(-3, .125, 3));
    auto Z = peaks(X, Y);
    // the fence color will be the average Z in that row
    vector_1d c;
    for (const auto &row : Z) {
        c.emplace_back(mean(row));
    }
    fence(X, Y, Z, c);
    colorbar();

    show();
    return 0;
}

example_fence_3

 1
 2
 3
 4
 5
 6
 7
 8
 9
10
11
12
13
#include <cmath>
#include <matplot/matplot.h>

int main() {
    using namespace matplot;
    auto [X, Y] = meshgrid(iota(-5, .5, 5));
    auto Z = transform(
        X, Y, [](double x, double y) { return y * sin(x) - x * cos(y); });
    fence(X, Y, Z)->edge_color("b").face_alpha(0.5);

    show();
    return 0;
}