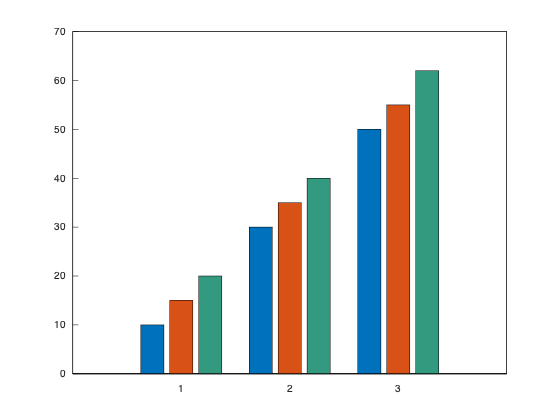
Skip to content

Bar Plot

1
bar(y);

example_bar_1

 1
 2
 3
 4
 5
 6
 7
 8
 9
10
11
12
13
14
#include <cmath>
#include <matplot/matplot.h>
#include <random>

int main() {
    using namespace matplot;

    std::vector<double> y = {75,  91,  105, 123.5, 131,  150,
                             179, 203, 226, 249,   281.5};
    bar(y);

    show();
    return 0;
}

More examples

example_bar_2

 1
 2
 3
 4
 5
 6
 7
 8
 9
10
11
12
13
14
15
#include <cmath>
#include <matplot/matplot.h>
#include <random>

int main() {
    using namespace matplot;

    std::vector<double> x = iota(1900, 10, 2000);
    std::vector<double> y = {75,  91,  105, 123.5, 131,  150,
                             179, 203, 226, 249,   281.5};
    bar(x, y);

    show();
    return 0;
}

example_bar_3

 1
 2
 3
 4
 5
 6
 7
 8
 9
10
11
12
13
14
#include <cmath>
#include <matplot/matplot.h>
#include <random>

int main() {
    using namespace matplot;

    std::vector<double> y = {75,  91,  105, 123.5, 131,  150,
                             179, 203, 226, 249,   281.5};
    bar(y, 0.4);

    show();
    return 0;
}

example_bar_4

 1
 2
 3
 4
 5
 6
 7
 8
 9
10
11
12
13
14
#include <cmath>
#include <matplot/matplot.h>
#include <random>

int main() {
    using namespace matplot;

    std::vector<std::vector<double>> Y = {
        {2, 2, 2, 2}, {2, 5, 8, 11}, {3, 6, 9, 12}};
    bar(Y);

    show();
    return 0;
}

example_bar_5

 1
 2
 3
 4
 5
 6
 7
 8
 9
10
11
12
13
14
#include <cmath>
#include <matplot/matplot.h>
#include <random>

int main() {
    using namespace matplot;

    std::vector<std::vector<double>> Y = {
        {2, 2, 2, 2}, {2, 5, 8, 11}, {3, 6, 9, 12}};
    barstacked(Y);

    show();
    return 0;
}

example_bar_6

 1
 2
 3
 4
 5
 6
 7
 8
 9
10
11
12
13
14
15
#include <cmath>
#include <matplot/matplot.h>
#include <random>

int main() {
    using namespace matplot;

    std::vector<double> x = {1980, 1990, 2000};
    std::vector<std::vector<double>> Y = {
        {15, 10, -10}, {20, -17, 5}, {-5, 21, 15}};
    barstacked(x, Y);

    show();
    return 0;
}

example_bar_7

 1
 2
 3
 4
 5
 6
 7
 8
 9
10
11
12
13
14
#include <cmath>
#include <matplot/matplot.h>
#include <random>

int main() {
    using namespace matplot;

    std::vector<double> y = {10, 21, 33, 52};
    bar(y);
    gca()->x_axis().ticklabels({"Small", "Medium", "Large", "Extra Large"});

    show();
    return 0;
}

example_bar_8

 1
 2
 3
 4
 5
 6
 7
 8
 9
10
11
12
13
14
15
16
17
18
19
20
21
22
23
24
25
26
27
28
#include <cmath>
#include <matplot/matplot.h>
#include <random>

int main() {
    using namespace matplot;

    std::vector<double> x = {1, 2, 3};
    std::vector<std::vector<double>> y = {{2, 3, 6}, {11, 23, 26}};
    auto b = bar(x, y);

    std::vector<double> label_x;
    std::vector<double> label_y;
    std::vector<std::string> labels;
    for (size_t i = 0; i < y.size(); ++i) {
        for (size_t j = 0; j < x.size(); ++j) {
            label_x.emplace_back(b->x_end_point(i, j));
            label_y.emplace_back(y[i][j] + 1);
            labels.emplace_back(num2str(y[i][j]));
        }
    }

    hold(on);
    text(label_x, label_y, labels);

    show();
    return 0;
}

example_bar_9

 1
 2
 3
 4
 5
 6
 7
 8
 9
10
11
12
13
14
15
16
17
18
19
#include <cmath>
#include <matplot/matplot.h>
#include <random>

int main() {
    using namespace matplot;

    std::vector<std::vector<double>> y = {{1, 4}, {2, 5}, {3, 6}};
    tiledlayout(2, 1);

    auto ax1 = nexttile();
    bar(ax1, y);

    auto ax2 = nexttile();
    barstacked(ax2, y);

    show();
    return 0;
}

example_bar_10

 1
 2
 3
 4
 5
 6
 7
 8
 9
10
11
12
13
14
#include <cmath>
#include <matplot/matplot.h>
#include <random>

int main() {
    using namespace matplot;

    std::vector<double> y = {75,  91,  105, 123.5, 131,  150,
                             179, 203, 226, 249,   281.5};
    bar(y)->face_color("r");

    show();
    return 0;
}

example_bar_11

 1
 2
 3
 4
 5
 6
 7
 8
 9
10
11
12
13
14
15
#include <cmath>
#include <matplot/matplot.h>
#include <random>

int main() {
    using namespace matplot;

    std::vector<double> y = {75,  91,  105, 123.5, 131,  150,
                             179, 203, 226, 249,   281.5};

    bar(y)->face_color({0.f, .5f, .5f}).edge_color({0.f, .9f, .9f}).line_width(1.5f);

    show();
    return 0;
}

example_bar_12

 1
 2
 3
 4
 5
 6
 7
 8
 9
10
11
12
13
14
15
16
#include <cmath>
#include <matplot/matplot.h>
#include <random>

int main() {
    using namespace matplot;

    std::vector<double> x1 = concat({1}, iota(3, 10));
    bar(x1, rand(9, 0, 1));
    hold(on);
    bar(std::vector<double>{2}, rand(1, 0, 1));
    gca()->x_axis().tick_values(iota(1, 10));

    show();
    return 0;
}

example_bar_13

 1
 2
 3
 4
 5
 6
 7
 8
 9
10
11
12
13
14
15
16
#include <cmath>
#include <matplot/matplot.h>
#include <random>

int main() {
    using namespace matplot;

    std::vector<std::vector<double>> y = {
        {10, 30, 50}, {15, 35, 55}, {20, 40, 62}};
    auto b = bar(y);
    b->face_colors()[2] = {0.f, .2f, .6f, .5f};
    gcf()->draw();

    show();
    return 0;
}