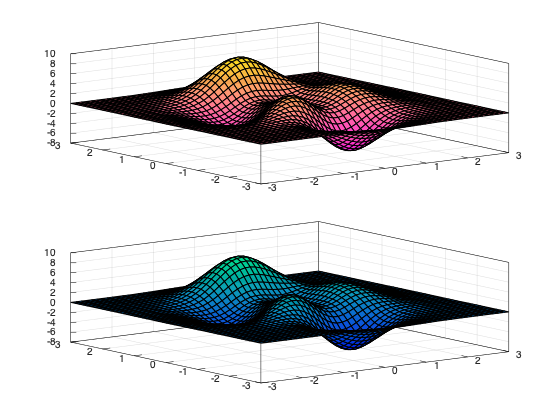
Skip to content

Colormap

As a convenience, the colors.h header contains many functions to generate colors from strings and vice-versa.

1
colormap(colors);

example_colormap_1

 1
 2
 3
 4
 5
 6
 7
 8
 9
10
11
12
#include <matplot/matplot.h>

int main() {
    using namespace matplot;

    auto [x, y, z] = peaks();
    surf(x, y, z);
    colormap(palette::winter());

    show();
    return 0;
}

More examples

example_colormap_2

 1
 2
 3
 4
 5
 6
 7
 8
 9
10
11
12
#include <matplot/matplot.h>

int main() {
    using namespace matplot;

    auto [x, y, z] = peaks();
    surf(x, y, z);
    colormap(palette::summer());

    show();
    return 0;
}

example_colormap_3

 1
 2
 3
 4
 5
 6
 7
 8
 9
10
11
12
13
#include <matplot/matplot.h>

int main() {
    using namespace matplot;

    auto [x, y, z] = peaks();
    surf(x, y, z);
    colormap(palette::summer());
    colormap(palette::default_map());

    show();
    return 0;
}

example_colormap_4

 1
 2
 3
 4
 5
 6
 7
 8
 9
10
11
12
13
14
15
16
17
18
19
20
21
22
23
#include <iostream>
#include <matplot/matplot.h>
#include <set>
#include <thread>
#include <vector>

int main() {
    using namespace matplot;

    auto [x, y, z] = peaks();

    tiledlayout();
    auto ax1 = nexttile();
    surf(x, y, z);
    colormap(ax1, palette::spring());

    auto ax2 = nexttile();
    surf(x, y, z);
    colormap(ax2, palette::winter());

    show();
    return 0;
}

example_colormap_5

 1
 2
 3
 4
 5
 6
 7
 8
 9
10
11
12
13
14
15
16
#include <iostream>
#include <matplot/matplot.h>
#include <set>
#include <thread>
#include <vector>

int main() {
    using namespace matplot;

    auto [x, y, z] = peaks();
    mesh(x, y, z);
    colormap(palette::parula(5));

    show();
    return 0;
}

example_colormap_6

 1
 2
 3
 4
 5
 6
 7
 8
 9
10
11
12
13
14
15
16
17
18
19
#include <iostream>
#include <matplot/matplot.h>
#include <set>
#include <thread>
#include <vector>

int main() {
    using namespace matplot;

    std::vector<std::vector<double>> map = {{0, 0, 0.3}, {0, 0, 0.4},
                                            {0, 0, 0.5}, {0, 0, 0.6},
                                            {0, 0, 0.8}, {0, 0, 1}};
    auto [x, y, z] = peaks();
    surf(x, y, z);
    colormap(map);

    show();
    return 0;
}

example_colormap_7

 1
 2
 3
 4
 5
 6
 7
 8
 9
10
11
12
13
14
15
16
17
18
19
20
21
#include <iostream>
#include <matplot/matplot.h>
#include <set>
#include <thread>
#include <vector>

int main() {
    using namespace matplot;

    auto [x, y, z] = peaks();
    mesh(x, y, z);
    colormap(palette::autumn(5));
    auto cmap = colormap();
    for (const auto &color : cmap) {
        std::cout << "r: " << color[0] << ", g: " << color[1]
                  << ", b: " << color[2] << std::endl;
    }

    show();
    return 0;
}

example_colormap_8

 1
 2
 3
 4
 5
 6
 7
 8
 9
10
11
12
13
14
15
16
17
18
19
#include <matplot/matplot.h>
#include <vector>

int main() {
    using namespace matplot;

    tiledlayout();
    auto ax1 = nexttile();
    auto [x, y, z] = peaks();
    contourf(x, y, z);
    colormap(ax1, palette::hot(8));

    auto ax2 = nexttile();
    contourf(x, y, z);
    colormap(ax2, palette::pink());

    show();
    return 0;
}

example_colormap_9

 1
 2
 3
 4
 5
 6
 7
 8
 9
10
11
12
13
14
15
16
#include <matplot/matplot.h>
#include <vector>

int main() {
    using namespace matplot;

    auto [X, Y] = meshgrid(iota(-5, .5, 5));
    auto Z = transform(
        X, Y, [](double X, double Y) { return pow(X, 2) + pow(Y, 2); });
    surf(X, Y, Z);
    colorbar();
    caxis({20, 50});

    show();
    return 0;
}