Skip to content

Geoplot

1
geoplot(lat,lon);

example_geoplot_1

 1
 2
 3
 4
 5
 6
 7
 8
 9
10
11
12
13
14
15
16
17
#include <cmath>
#include <matplot/matplot.h>

int main() {
    using namespace matplot;

    double lat_seattle = 47.62;
    double lon_seattle = -122.33;
    double lat_anchorage = 61.20;
    double lon_anchorage = -149.9;
    geoplot(std::vector{lat_seattle, lat_anchorage},
            std::vector{lon_seattle, lon_anchorage}, "g-*");
    geolimits({45, 62}, {-155, -120});

    show();
    return 0;
}

More examples

example_geoplot_2

 1
 2
 3
 4
 5
 6
 7
 8
 9
10
11
12
13
14
15
16
17
18
19
20
#include <cmath>
#include <matplot/matplot.h>

int main() {
    using namespace matplot;

    double lat_seattle = 47.62;
    double lon_seattle = -122.33;
    double lat_anchorage = 61.20;
    double lon_anchorage = -149.9;
    geoplot(std::vector{lat_seattle, lat_anchorage},
            std::vector{lon_seattle, lon_anchorage}, "g-*");
    geolimits({45, 62}, {-155, -120});

    text(lon_anchorage, lat_anchorage, "Anchorage");
    text(lon_seattle, lat_seattle, "Seattle");

    show();
    return 0;
}

example_geoplot_3

 1
 2
 3
 4
 5
 6
 7
 8
 9
10
11
12
13
14
15
16
#include <cmath>
#include <matplot/matplot.h>

int main() {
    using namespace matplot;

    auto [lon, lat, names] = world_cities(6, 8);
    auto [lon_star, lat_star] = greedy_tsp(lon, lat);
    geoplot(lat_star, lon_star)
        ->marker("o")
        .marker_colors(iota(1., static_cast<double>(names.size())));
    text(lon, lat, names);

    show();
    return 0;
}

example_geoplot_4

 1
 2
 3
 4
 5
 6
 7
 8
 9
10
11
12
13
14
15
16
17
18
19
20
21
22
23
24
25
26
27
28
#include <cmath>
#include <matplot/matplot.h>

int main() {
    using namespace matplot;

    double lat_seattle = 47.62;
    double lon_seattle = -122.33;
    double lat_anchorage = 61.20;
    double lon_anchorage = -149.9;
    double lat_pt_barrow = 71.38;
    double lon_pt_barrow = -156.47;

    geoplot(std::vector{lat_seattle, lat_anchorage},
            std::vector{lon_seattle, lon_anchorage}, "y-");
    hold(on);
    geoplot(std::vector{lat_seattle, lat_pt_barrow},
            std::vector{lon_seattle, lon_pt_barrow}, "b:");

    geolimits(44, 75, -170, -100);

    text(lon_anchorage, lat_anchorage, "Anchorage");
    text(lon_seattle, lat_seattle, "Seattle");
    text(lon_pt_barrow, lat_pt_barrow, "Point Barrow");

    show();
    return 0;
}

example_geoplot_5

 1
 2
 3
 4
 5
 6
 7
 8
 9
10
11
12
13
14
15
16
17
18
19
20
21
22
23
24
25
26
27
28
29
30
#include <cmath>
#include <matplot/matplot.h>

int main() {
    using namespace matplot;

    double lat_seattle = 47.62;
    double lon_seattle = -122.33;
    double lat_anchorage = 61.20;
    double lon_anchorage = -149.9;

    auto g = geoplot(std::vector{lat_seattle, lat_anchorage},
                     std::vector{lon_seattle, lon_anchorage});
    g->line_width(2.);
    hold(on);

    geolimits({44, 75}, {-170, -100});

    text(lon_anchorage, lat_anchorage, "Anchorage");
    text(lon_seattle, lat_seattle, "Seattle");

    color_array terrain = {0.f, 0.71f, 0.65f, 0.59f};
    geoplot()->color(terrain);

    color_array blue_water = {0.f, 0.4f, 0.61f, 0.76f};
    gca()->color(blue_water);

    show();
    return 0;
}

example_geoplot_6

  1
  2
  3
  4
  5
  6
  7
  8
  9
 10
 11
 12
 13
 14
 15
 16
 17
 18
 19
 20
 21
 22
 23
 24
 25
 26
 27
 28
 29
 30
 31
 32
 33
 34
 35
 36
 37
 38
 39
 40
 41
 42
 43
 44
 45
 46
 47
 48
 49
 50
 51
 52
 53
 54
 55
 56
 57
 58
 59
 60
 61
 62
 63
 64
 65
 66
 67
 68
 69
 70
 71
 72
 73
 74
 75
 76
 77
 78
 79
 80
 81
 82
 83
 84
 85
 86
 87
 88
 89
 90
 91
 92
 93
 94
 95
 96
 97
 98
 99
100
101
102
103
104
105
106
107
108
109
110
111
112
113
114
115
116
117
118
119
120
121
122
123
124
125
126
127
128
129
130
131
132
133
134
135
136
137
138
139
140
141
142
143
144
145
146
147
148
149
150
151
152
153
154
155
156
157
158
159
160
161
162
163
164
165
166
167
168
169
170
171
172
173
174
175
176
177
178
179
180
181
182
183
184
185
186
187
188
189
190
191
192
193
194
195
196
197
198
199
200
201
202
203
204
205
206
207
208
209
210
211
212
213
214
215
216
217
218
219
220
221
222
223
224
#include <matplot/matplot.h>
#include <random>

using namespace matplot;
using namespace std;

class eurotrip_solver {
  public:
    eurotrip_solver(const vector<double> &lat, const vector<double> &lon,
                    const vector<string> &names, axes_handle ax);
    void run(size_t iterations = 100);

  private:
    void setup_starting_point(size_t iteration);
    double tour_distance(const vector<size_t> &tour);
    void iteration();
    static vector<vector<size_t>>
    get_neighbors(const std::vector<size_t> &tour);
    bool update_if_better(const vector<size_t> &neighbor);
    void draw_if_improvement();
    void draw();

  private:
    vector<double> lat_;
    vector<double> lon_;
    vector<string> names_;
    axes_handle ax_;

    // Current tour
    double curr_dist_{0.0};
    vector<size_t> curr_tour_;

    // Best tour
    double min_dist_{0.0};
    vector<size_t> best_tour_;
};

eurotrip_solver::eurotrip_solver(const vector<double> &lat,
                                 const vector<double> &lon,
                                 const vector<string> &names, axes_handle ax)
    : lat_(lat), lon_(lon), names_(names), ax_(ax) {}

void eurotrip_solver::run(size_t iterations) {
    for (size_t i = 0; i < iterations; ++i) {
        setup_starting_point(i);
        iteration();
    }
    ax_->draw();
    ax_->parent()->save("eurotrip.svg");
}

void eurotrip_solver::setup_starting_point(size_t iteration) {
    std::cout << "Starting point " << iteration << std::endl;
    if (iteration < names_.size()) {
        auto [lon_ignore, lat_ignore, tour] =
            greedy_tsp_with_idx(lon_, lat_, iteration);
        (void) lon_ignore;
        (void) lat_ignore;
        curr_tour_ = tour;
        curr_dist_ = tour_distance(curr_tour_);
    } else {
        static std::mt19937 g((std::random_device())());
        std::iota(curr_tour_.begin(), curr_tour_.end(), 0);
        std::shuffle(curr_tour_.begin(), curr_tour_.end(), g);
        curr_dist_ = tour_distance(curr_tour_);
    }
    if (iteration == 0 || curr_dist_ < min_dist_) {
        best_tour_ = curr_tour_;
        min_dist_ = curr_dist_;
    }
}

vector<vector<size_t>>
eurotrip_solver::get_neighbors(const std::vector<size_t> &tour) {
    vector<vector<size_t>> neighbors;
    constexpr size_t n_movements = 2;
    for (size_t i = 0; i < tour.size() - 1; ++i) {
        for (size_t j = i + 1; j < tour.size(); ++j) {
            for (size_t movement = 0; movement < n_movements; ++movement) {
                vector<size_t> neighbor = tour;
                if (movement == 0) {
                    std::swap(neighbor[i], neighbor[j]);
                } else {
                    std::reverse(neighbor.begin() + i,
                                 neighbor.begin() + j + 1);
                }
                neighbors.emplace_back(neighbor);
            }
        }
    }
    return neighbors;
}

void eurotrip_solver::iteration() {
    bool improvement = true;
    while (improvement) {
        improvement = false;
        for (const auto &neighbor : get_neighbors(curr_tour_)) {
            improvement = update_if_better(neighbor);
            draw_if_improvement();
            if (improvement) {
                break;
            }
        }
    }
}

double eurotrip_solver::tour_distance(const vector<size_t> &tour) {
    double sum = 0.;
    for (size_t i = 0; i < tour.size() - 1; ++i) {
        sum += distance(lon_[tour[i]], lat_[tour[i]], lon_[tour[i + 1]],
                        lat_[tour[i + 1]]);
    }
    sum += distance(lon_[tour[tour.size() - 1]], lat_[tour[tour.size() - 1]],
                    lon_[tour[0]], lat_[tour[0]]);
    return sum;
}

void eurotrip_solver::draw() {
    ax_->clear();

    ax_->geolimits(min(lat_) - 5, max(lat_) + 5, min(lon_) - 2, max(lon_) + 10);

    vector<double> sorted_lat;
    vector<double> sorted_lon;
    for (const size_t &idx : best_tour_) {
        sorted_lat.emplace_back(lat_[idx]);
        sorted_lon.emplace_back(lon_[idx]);
    }
    sorted_lat.emplace_back(lat_[best_tour_[0]]);
    sorted_lon.emplace_back(lon_[best_tour_[0]]);
    ax_->geoplot(sorted_lat, sorted_lon);

    ax_->hold(true);
    ax_->geoscatter(lat_, lon_);

    auto [lon_c, lat_c, names_c] =
        clear_overlapping_labels(lon_, lat_, names_, 1, 1);
    ax_->text(lon_c, lat_c, names_c);

    ax_->title("Tour distance " + num2str(min_dist_));

    ax_->draw();
}

bool eurotrip_solver::update_if_better(const vector<size_t> &neighbor) {
    double d = tour_distance(neighbor);
    if (d < curr_dist_) {
        curr_tour_ = neighbor;
        curr_dist_ = d;
        if (d < min_dist_) {
            best_tour_ = curr_tour_;
            min_dist_ = d;
        }
        return true;
    }
    return false;
}

void eurotrip_solver::draw_if_improvement() {
    static auto last_draw =
        chrono::high_resolution_clock::now() - chrono::seconds(1);
    static auto min_dist_when_last_draw = min_dist_;
    const auto current_time = chrono::high_resolution_clock::now();
    const bool its_been_a_while = current_time - last_draw > chrono::seconds(1);
    const bool things_are_better = min_dist_ < min_dist_when_last_draw;
    if (its_been_a_while && things_are_better) {
        last_draw = current_time;
        min_dist_when_last_draw = min_dist_;
        draw();
    }
}

int main() {
    vector<string> names = {"Tirana",    "Andorra la Vella",
                            "Vienna",    "Minsk",
                            "Brussels",  "Sarajevo",
                            "Sofia",     "Zagreb",
                            "Prague",    "Copenhagen",
                            "Tallinn",   "Helsinki",
                            "Paris",     "Berlin",
                            "Athens",    "Budapest",
                            "Reykjavik", "Dublin",
                            "Rome",      "Pristina",
                            "Riga",      "Vaduz",
                            "Vilnius",   "Luxembourg",
                            "Valletta",  "Chisinau",
                            "Monaco",    "Podgorica",
                            "Amsterdam", "Skopje",
                            "Oslo",      "Warsaw",
                            "Lisbon",    "Bucharest",
                            "Moscow",    "San Marino",
                            "Belgrade",  "Bratislava",
                            "Ljubljana", "Madrid",
                            "Stockholm", "Bern",
                            "Kiev",      "London"};

    vector<double> lat = {
        +41.3317, +42.5075, +48.2092, +53.9678, +50.8371, +43.8608, +42.7105,
        +45.8150, +50.0878, +55.6763, +59.4389, +60.1699, +48.8567, +52.5235,
        +37.9792, +47.4984, +64.1353, +53.3441, +41.8955, +42.6740, +56.9465,
        +47.1411, +54.6896, +49.6100, +35.9042, +47.0167, +43.7325, +42.4602,
        +52.3738, +42.0024, +59.9138, +52.2297, +38.7072, +44.4479, +55.7558,
        +43.9424, +44.8048, +48.2116, +46.0514, +40.4167, +59.3328, +46.9480,
        +50.4422, +51.5002};

    vector<double> lon = {
        +19.8172, +1.5218,  +16.3728, +27.5766, +4.3676,  +18.4214, +23.3238,
        +15.9785, +14.4205, +12.5681, +24.7545, +24.9384, +2.3510,  +13.4115,
        +23.7166, +19.0408, -21.8952, -6.2675,  +12.4823, +21.1788, +24.1049,
        +9.5215,  +25.2799, +6.1296,  +14.5189, +28.8497, +7.4189,  +19.2595,
        +4.8910,  +21.4361, +10.7387, +21.0122, -9.1355,  +26.0979, +37.6176,
        +12.4578, +20.4781, +17.1547, +14.5060, -3.7033,  +18.0645, +7.4481,
        +30.5367, -0.1262};

    std::cout << names.size() << " cities" << std::endl;

    figure_handle f = figure(true);
    eurotrip_solver s(lat, lon, names, f->current_axes());
    s.run();

    show();
    return 0;
}

example_geoplot_7

  1
  2
  3
  4
  5
  6
  7
  8
  9
 10
 11
 12
 13
 14
 15
 16
 17
 18
 19
 20
 21
 22
 23
 24
 25
 26
 27
 28
 29
 30
 31
 32
 33
 34
 35
 36
 37
 38
 39
 40
 41
 42
 43
 44
 45
 46
 47
 48
 49
 50
 51
 52
 53
 54
 55
 56
 57
 58
 59
 60
 61
 62
 63
 64
 65
 66
 67
 68
 69
 70
 71
 72
 73
 74
 75
 76
 77
 78
 79
 80
 81
 82
 83
 84
 85
 86
 87
 88
 89
 90
 91
 92
 93
 94
 95
 96
 97
 98
 99
100
101
102
103
104
105
106
107
108
109
110
111
112
113
114
115
116
117
118
119
120
121
122
123
124
125
126
127
128
129
130
131
132
133
134
135
136
137
138
139
140
141
142
143
144
145
146
147
148
149
150
151
152
153
154
155
156
157
158
159
160
161
162
163
164
165
166
167
168
169
170
171
172
173
174
175
176
177
178
179
180
181
182
183
184
185
186
187
188
189
190
191
192
193
194
195
196
197
198
199
200
201
202
203
204
205
206
207
208
209
210
211
212
213
214
215
216
217
218
219
220
221
222
#include <matplot/matplot.h>
#include <random>

using namespace matplot;
using namespace std;

class americas_trip_solver {
  public:
    americas_trip_solver(const vector<double> &lat, const vector<double> &lon,
                         const vector<string> &names, axes_handle ax);
    void run(size_t iterations = 100);

  private:
    void setup_axes();
    void setup_starting_point(size_t iteration);
    double tour_distance(const vector<size_t> &tour);
    void iteration();
    static vector<vector<size_t>>
    get_neighbors(const std::vector<size_t> &tour);
    bool update_if_better(const vector<size_t> &neighbor);
    void draw_if_improvement();
    void draw();

  private:
    vector<double> lat_;
    vector<double> lon_;
    vector<string> names_;
    axes_handle ax_;
    line_handle lh_;

    // Current tour
    double curr_dist_{0.0};
    vector<size_t> curr_tour_;

    // Best tour
    double min_dist_{0.0};
    vector<size_t> best_tour_;
};

americas_trip_solver::americas_trip_solver(const vector<double> &lat,
                                           const vector<double> &lon,
                                           const vector<string> &names,
                                           axes_handle ax)
    : lat_(lat), lon_(lon), names_(names), ax_(ax) {
    setup_axes();
}

void americas_trip_solver::run(size_t iterations) {
    for (size_t i = 0; i < iterations; ++i) {
        setup_starting_point(i);
        iteration();
    }
    ax_->draw();
    ax_->parent()->save("americastrip.svg");
}

void americas_trip_solver::setup_starting_point(size_t iteration) {
    std::cout << "Starting point " << iteration << std::endl;
    if (iteration < names_.size()) {
        auto [lon_ignore, lat_ignore, tour] =
            greedy_tsp_with_idx(lon_, lat_, iteration);
        (void) lon_ignore;
        (void) lat_ignore;
        curr_tour_ = tour;
        curr_dist_ = tour_distance(curr_tour_);
    } else {
        static std::mt19937 g((std::random_device())());
        std::iota(curr_tour_.begin(), curr_tour_.end(), 0);
        std::shuffle(curr_tour_.begin(), curr_tour_.end(), g);
        curr_dist_ = tour_distance(curr_tour_);
    }
    if (iteration == 0 || curr_dist_ < min_dist_) {
        best_tour_ = curr_tour_;
        min_dist_ = curr_dist_;
    }
}

vector<vector<size_t>>
americas_trip_solver::get_neighbors(const std::vector<size_t> &tour) {
    vector<vector<size_t>> neighbors;
    constexpr size_t n_movements = 2;
    for (size_t i = 0; i < tour.size() - 1; ++i) {
        for (size_t j = i + 1; j < tour.size(); ++j) {
            for (size_t movement = 0; movement < n_movements; ++movement) {
                vector<size_t> neighbor = tour;
                if (movement == 0) {
                    std::swap(neighbor[i], neighbor[j]);
                } else {
                    std::reverse(neighbor.begin() + i,
                                 neighbor.begin() + j + 1);
                }
                neighbors.emplace_back(neighbor);
            }
        }
    }
    return neighbors;
}

void americas_trip_solver::iteration() {
    bool improvement = true;
    while (improvement) {
        improvement = false;
        for (const auto &neighbor : get_neighbors(curr_tour_)) {
            improvement = update_if_better(neighbor);
            draw_if_improvement();
            if (improvement) {
                break;
            }
        }
    }
}

double americas_trip_solver::tour_distance(const vector<size_t> &tour) {
    double sum = 0.;
    for (size_t i = 0; i < tour.size() - 1; ++i) {
        sum += distance(lon_[tour[i]], lat_[tour[i]], lon_[tour[i + 1]],
                        lat_[tour[i + 1]]);
    }
    sum += distance(lon_[tour[tour.size() - 1]], lat_[tour[tour.size() - 1]],
                    lon_[tour[0]], lat_[tour[0]]);
    return sum;
}

void americas_trip_solver::draw() {
    vector<double> sorted_lat;
    vector<double> sorted_lon;
    for (const size_t &idx : best_tour_) {
        sorted_lat.emplace_back(lat_[idx]);
        sorted_lon.emplace_back(lon_[idx]);
    }
    sorted_lat.emplace_back(lat_[best_tour_[0]]);
    sorted_lon.emplace_back(lon_[best_tour_[0]]);
    lh_->x_data(sorted_lon);
    lh_->y_data(sorted_lat);
    ax_->title("Tour distance " + num2str(min_dist_));
    ax_->draw();
}

bool americas_trip_solver::update_if_better(const vector<size_t> &neighbor) {
    double d = tour_distance(neighbor);
    if (d < curr_dist_) {
        curr_tour_ = neighbor;
        curr_dist_ = d;
        if (d < min_dist_) {
            best_tour_ = curr_tour_;
            min_dist_ = d;
        }
        return true;
    }
    return false;
}

void americas_trip_solver::draw_if_improvement() {
    static auto last_draw =
        chrono::high_resolution_clock::now() - chrono::seconds(1);
    static auto min_dist_when_last_draw = min_dist_;
    const auto current_time = chrono::high_resolution_clock::now();
    const bool its_been_a_while = current_time - last_draw > chrono::seconds(1);
    const bool things_are_better = min_dist_ < min_dist_when_last_draw;
    if (its_been_a_while && things_are_better) {
        last_draw = current_time;
        min_dist_when_last_draw = min_dist_;
        draw();
    }
}

void americas_trip_solver::setup_axes() {
    ax_->clear();
    ax_->geolimits(min(lat_) - 5, max(lat_) + 5, min(lon_) - 30,
                   max(lon_) + 50);
    lh_ = ax_->geoplot(lat_, lon_);
    ax_->hold(true);
    ax_->geoscatter(lat_, lon_);
    auto [lon_c, lat_c, names_c] =
        clear_overlapping_labels(lon_, lat_, names_, 2, 2);
    ax_->text(lon_c, lat_c, names_c);
    ax_->draw();
}

int main() {
    vector<string> names = {
        "Marigot",        "The Valley",     "Saint John's",    "Buenos Aires",
        "Oranjestad",     "Nassau",         "Bridgetown",      "Belmopan",
        "Hamilton",       "La Paz",         "Brasilia",        "Road Town",
        "Ottawa",         "George Town",    "Santiago",        "Bogota",
        "San Jose",       "Havana",         "Willemstad",      "Roseau",
        "Santo Domingo",  "Quito",          "San Salvador",    "Stanley",
        "Nuuk",           "Saint George's", "Guatemala City",  "Georgetown",
        "Port-au-Prince", "Tegucigalpa",    "Kingston",        "Mexico City",
        "Plymouth",       "Managua",        "Panama City",     "Asuncion",
        "Lima",           "San Juan",       "Gustavia",        "Basseterre",
        "Castries",       "Saint-Pierre",   "Kingstown",       "Philipsburg",
        "Paramaribo",     "Port of Spain",  "Grand Turk",      "Washington",
        "Montevideo",     "Caracas",        "Charlotte Amalie"};

    vector<double> lat = {
        18.0731,  18.2166, 17.1166, -34.5833, 12.5166, 25.0833, 13.1,
        17.25,    32.2833, -16.5,   -15.7833, 18.4166, 45.4166, 19.3,
        -33.45,   4.6,     9.9333,  23.1166,  12.1,    15.3,    18.4666,
        -0.2166,  13.7,    -51.7,   64.1833,  12.05,   14.6166, 6.8,
        18.5333,  14.1,    18,      19.4333,  16.7,    12.1333, 8.9666,
        -25.2666, -12.05,  18.4666, 17.8833,  17.3,    14,      46.7666,
        13.1333,  18.0166, 5.8333,  10.65,    21.4666, 38.8833, -34.85,
        10.4833,  18.35};

    vector<double> lon = {
        -63.0822, -63.0500, -61.8500, -58.6666, -70.0333, -77.3500, -59.6166,
        -88.7666, -64.7833, -68.1500, -47.9166, -64.6166, -75.7000, -81.3833,
        -70.6666, -74.0833, -84.0833, -82.3500, -68.9166, -61.4000, -69.9000,
        -78.5000, -89.2000, -57.8500, -51.7500, -61.7500, -90.5166, -58.1500,
        -72.3333, -87.2166, -76.8000, -99.1333, -62.2166, -86.2500, -79.5333,
        -57.6666, -77.0500, -66.1166, -62.8500, -62.7166, -61.0000, -56.1833,
        -61.2166, -63.0333, -55.1666, -61.5166, -71.1333, -77.0000, -56.1666,
        -66.8666, -64.9333};

    figure_handle f = figure(true);
    americas_trip_solver s(lat, lon, names, f->current_axes());
    s.run();

    show();
    return 0;
}

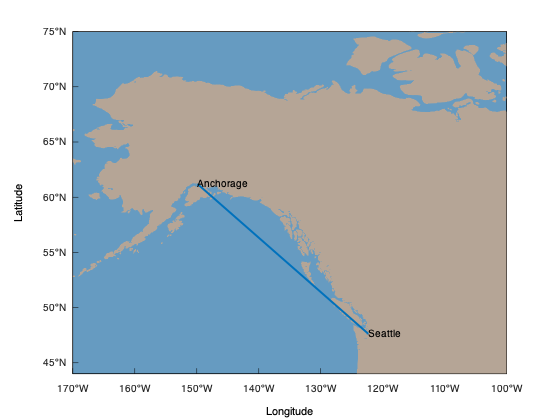
For the first geography plot, Matplot++ calls geoplot(), which creates a filled polygon with the world map. This first plot receives the tag "map" so that subsequent geography plots recognize there is no need to recreate this world map.

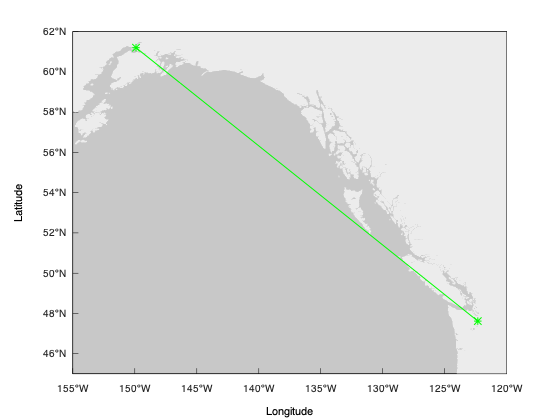
The data for the world map comes from Natural Earth. They provide data at 1:10m, 1:50m, and 1:110m scales. The geoplot function will initially use the data at the 1:110m scales. The geolimits function can be used to update the axis limits for geography plots. The difference between the usual functions for adjusting axis limits (xlim and ylim) and geolimits is that the latter will also update the map resolution according to the new limits for the and axis.

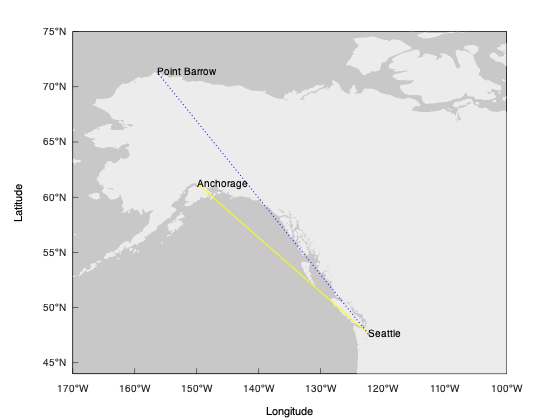
The geolimits function will query the figure size and, depending on the new limits for the axes, update the map to the 1:10m, or 1:50m scales if needed. Because it would be very inefficient to render the whole world map at a 1:10m or 1:50m scale only to display a region of this map, the geolimits function also crops the data pertinent to the new region being displayed.

Note that this does not only involve removing data points outside the new limits but it also needs to create new data points on the correct borders to create new polygons coherent with the map entry points in the region. For this reason, the algorithm needs to track all submaps represented as closed polygons in the original world map. If submaps are completely inside or outside the new ranges, we can respectively include or dismiss the data points. However, if the submap is only partially inside the new limits, to generate the correct borders for the polygons, we need to track all points outside the limits to classify the directions of these points outside the limits. We do that by only including points that change quadrants around the new limits so that the map entry points create polygons that look like they would if the complete world map were still being rendered outside these new limits.

If the you are not interested in geographic plots, the build script includes an option to remove the high-resolution maps at 1:10m and 1:50m scales from the library. In this case, the library will always use the map at a 1:110m scale no matter the axis limits.

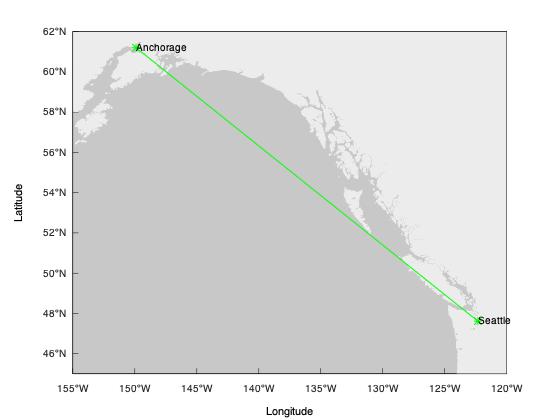
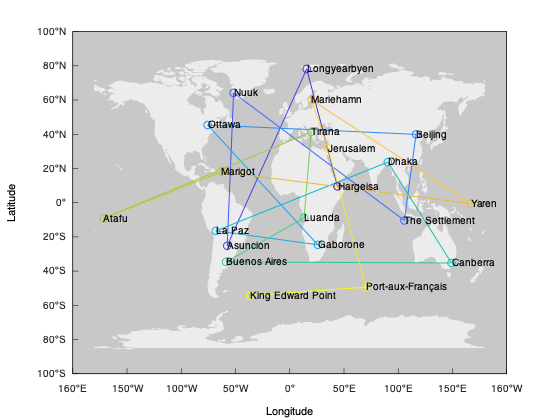
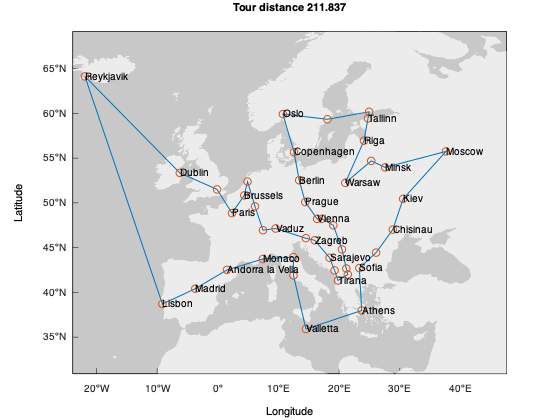
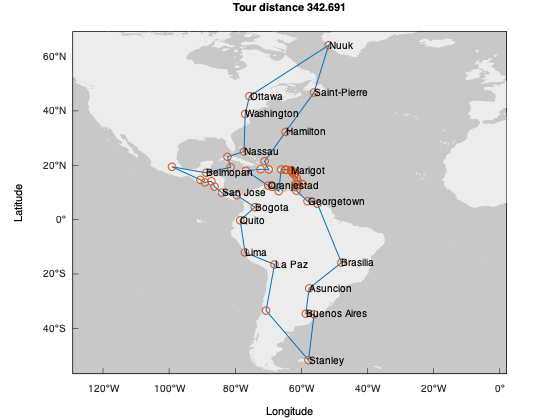
The function world_cities returns a list of major world cities. Its parameters define the minimum distances between cities in the and axes. The greedy_tsp function is a naive greedy algorithm to find a route between these cities as a Traveling Salesman Problem (TSP). We use the geoplot function to draw this route. Note that we use method chaining to define some further plot properties. Finally, the text function includes the city names in the map.