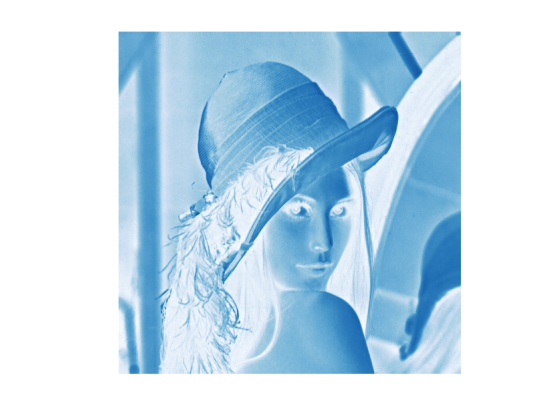
Skip to content

Image Show

1
imshow(image);

example_imshow_1

 1
 2
 3
 4
 5
 6
 7
 8
 9
10
#include <matplot/matplot.h>

int main() {
    using namespace matplot;
    auto image = imread("lena_gray.tiff");
    imshow(image);

    show();
    return 0;
}

More examples

example_imshow_2

 1
 2
 3
 4
 5
 6
 7
 8
 9
10
#include <matplot/matplot.h>

int main() {
    using namespace matplot;
    auto image = imread("lena_color.tiff");
    imshow(image);

    show();
    return 0;
}

example_imshow_3

 1
 2
 3
 4
 5
 6
 7
 8
 9
10
11
12
13
14
15
16
17
18
19
20
21
22
23
24
25
26
27
#include <matplot/matplot.h>

int main() {
    using namespace matplot;
    auto image = imread("lena_gray.tiff");

    auto &gray = image[0];
    auto [h, w] = size(gray);
    double mean_intensity = 0;
    for (const auto &row : gray) {
        for (const auto &pixel : row) {
            mean_intensity += pixel;
        }
    }
    mean_intensity /= (h * w);

    for (auto &row : gray) {
        for (auto &pixel : row) {
            pixel = pixel > mean_intensity ? 255 : 0;
        }
    }

    imshow(gray);

    show();
    return 0;
}

example_imshow_4

1
2
3
4
5
6
7
8
9
#include <matplot/matplot.h>

int main() {
    using namespace matplot;
    imshow("lena_color.tiff");

    show();
    return 0;
}

example_imshow_5

 1
 2
 3
 4
 5
 6
 7
 8
 9
10
11
#include <matplot/matplot.h>

int main() {
    using namespace matplot;
    auto image = imread("lena_gray.tiff");
    imshow(image[0]);
    colormap(palette::greens());

    show();
    return 0;
}

example_imshow_6

 1
 2
 3
 4
 5
 6
 7
 8
 9
10
11
#include <matplot/matplot.h>

int main() {
    using namespace matplot;
    auto image = imread("lena_gray.tiff");
    imshow(image[0]);
    colormap(palette::default_map());

    show();
    return 0;
}

example_imshow_7

 1
 2
 3
 4
 5
 6
 7
 8
 9
10
11
#include <matplot/matplot.h>

int main() {
    using namespace matplot;
    image_channels_t image = imread("lena_color.tiff");
    image = imvignette(image);
    imshow(image);

    show();
    return 0;
}

example_imshow_8

 1
 2
 3
 4
 5
 6
 7
 8
 9
10
11
#include <matplot/matplot.h>

int main() {
    using namespace matplot;
    image_channels_t image = imread("lena_gray.tiff");
    image = imvignette(image);
    imshow(image);

    show();
    return 0;
}

example_imshow_9

 1
 2
 3
 4
 5
 6
 7
 8
 9
10
11
#include <matplot/matplot.h>

int main() {
    using namespace matplot;
    image_channels_t image = imread("lena_color.tiff");
    image = imresize(image, 0.1, image_interpolation::bilinear);
    imshow(image);

    show();
    return 0;
}

example_imshow_10

 1
 2
 3
 4
 5
 6
 7
 8
 9
10
11
12
13
14
15
16
17
18
19
20
21
22
23
24
25
26
27
28
29
30
#include <matplot/matplot.h>

int main() {
    using namespace matplot;
    image_channels_t image = imread("lena_color.tiff");
    image = imvignette(image);

    auto image_to_show = imresize(image, 0.5);
    imshow(image_to_show);

    auto image_to_save = imresize(image, 2., image_interpolation::bicubic);
    imwrite(image_to_save, "lena_bicubic.tiff");

    imwrite(imresize(image, 2., image_interpolation::bilinear),
            "lena_bilinear.tiff");

    imwrite(imresize(image, 2., image_interpolation::grid), "lena_grid.tiff");

    imwrite(imresize(image, 2., image_interpolation::lanczos),
            "lena_lanczos.tiff");

    imwrite(imresize(image, 2., image_interpolation::moving_average),
            "lena_moving_average.tiff");

    imwrite(imresize(image, 2., image_interpolation::nearest),
            "lena_nearest.tiff");

    show();
    return 0;
}

example_imshow_11

 1
 2
 3
 4
 5
 6
 7
 8
 9
10
11
12
13
14
#include <matplot/matplot.h>

int main() {
    using namespace matplot;
    image_channels_t image = imread("lena_gray.tiff");

    imshow(image[0]);
    colormap(palette::blues());

    imwrite(image[0], palette::blues(), "lena_blues.tiff");

    show();
    return 0;
}

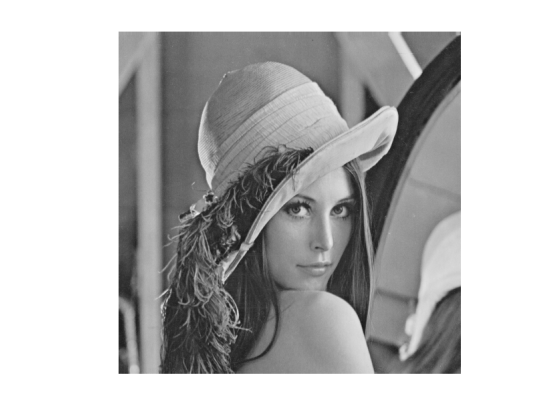
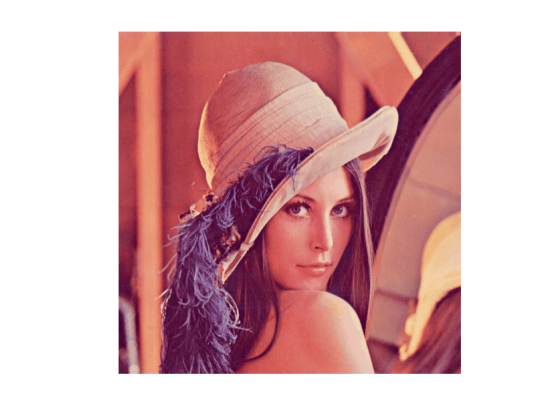
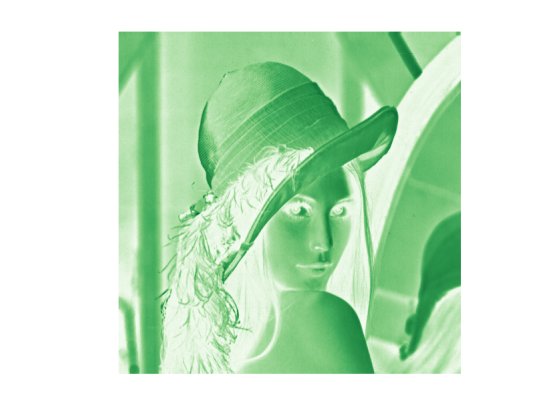
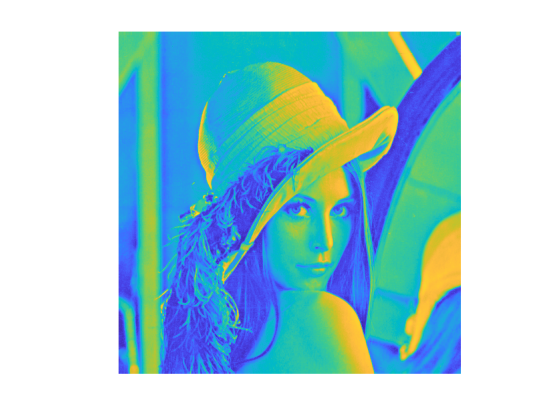
These subcategories depend on the matrix class. The matrix class can have up to four matrices. If it has only one matrix, it is represented with a colormap. If it has three matrices, they represent the red, green, and blue channels. If it has four matrices, the fourth matrix represents an alpha channel to control the transparency of each pixel.

We use the CImg library to load and save images. CImg can handle many common image formats as long as it has access to the appropriate libraries. The Matplot++ build script will look at compile-time for the following optional libraries: JPEG, TIFF, ZLIB, PNG, LAPACK, BLAS, OpenCV, X11, fftw3, OpenEXR, and Magick++. The build script will attempt to link all libraries from this list to Matplot++.

Matplot++ includes a few convenience functions to manipulate matrices with images: imread, rgb2gray, gray2rgb, imresize, and imwrite. All these functions work with lists of matrices.